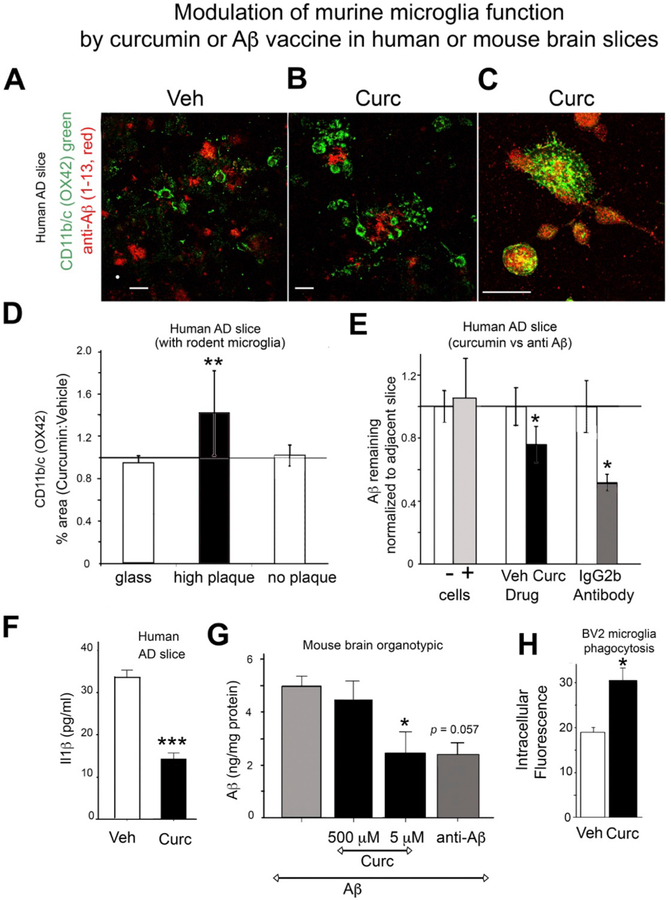
Fig. 5.
Human Alzheimer’s disease autopsied brain sections cultured with mouse microglia and treated with curcumin in vitro. (A-F) Microglia (from neonatal mice; 400,000 cells) were evenly seeded on top of cryostat sections (10 μm thick) of AD human brain with high amyloid plaque burden. Cultures were maintained for 48 h, then harvested for Aβ ELISA or fixed for ICC. (A, B, C) Sections were double-labeled for Aβ (red, 4G8 (Aβ1–13) antibody) and microglia (green, OX42, an antibody to CD11b/c) for confocal microscopy. Compared to vehicle treatment (A), curcumin treatment (0.1 μM) increased clustering of microglial around plaques (B), which suggested that CDllb/c co-localized with Aβ staining (yellow) (C). The magnification scale bar indicates 50 μm. (D) Percentage area stained with OX42 in AD brain sections was calculated using Image J and values for curcumin treatment (0.1 μM) normalized to control. Plaque-containing regions but not non-plaque containing regions or control glass, showed that Curc increased CD11b/c staining (50% increase, t-test **p = .008). (E) The effect of curcumin or Aβ antibody (10G4) in AD brain slices co-cultured with or without primary murine microglia on Aβ levels (measured by ELISA). Adjacent AD brain slices were used pairwise for treatment (treat.) and control (cnt.) conditions, so that Aβ levels were similar across pairs [n = 6 pairs of cultures for curcumin (0.1 μM) vs. vehicle; n = 6 pairs for microglia (+ cells) vs. no microglia (− cells); and n = 3 pairs for 10G4 vs. control antibody (IgG2b)]. Aβ levels for each treatment were normalized to levels in adjacent control slices. Aβ levels in paired treatment and control slices were analyzed by a non-parametric pairwise statistical test. The presence of microglia (+ cells) did not change Aβ levels compared to adjacent slices without microglia (−cells). Curcumin and 10G4 treatment reduced the level of Aβ by 24% (p < .04) and 48% (p = .025), respectively. (F) IL-1β in microglia-conditioned media. Il-1β was measured by a mouse-specific ELISA in media from curcumin (0.1 μM) treated and control (ethanol) treated microglia that were cultured on unfixed AD brain tissue slices. Curcumin treatment (0.1 μM) reduced the level of IL-1β by 61% (***ANOVA p < 1 × 10⁻⁶). (G) Ex vivo organotypic hippocampal slice cultures from wild-type mice were exposed to exogenous Aβ40 for 4 days and then treated with curcumin at low dose (5 μM) or high dose (500 μM) or the anti-Aβ antibody 10G4 (5 mg/ml) for 4 more days. Aβ levels in treated slices were normalized to Aβ levels in vehicle treated slices. Aβ levels measured by ELISA were reduced by low dose curcumin by 51% (*p < .05) but were not changed with high dose curcumin, and the anti-Aβ antibody 10G4 reduced Aβ levels by 52% (p < .057). (H) BV2 microglia phagocytosis of fluorescent E. coli particles. Pretreatment of BV2 cells with 1 μM curcumin stimulated phagocytosis by 57% (*p < .05). Independent samples t-test showed a significant difference in values of phagocytosed fluorescent E-coli in cells after treatment with curcumin (mean = 30.25, SD 5.888) versus vehicle (mean = 19.5, SD 2.986); T(6) = −3.56). Error bars indicate the SEM. (For interpretation of the references to colour in this figure legend, the reader is referred to the web version of this article.)

