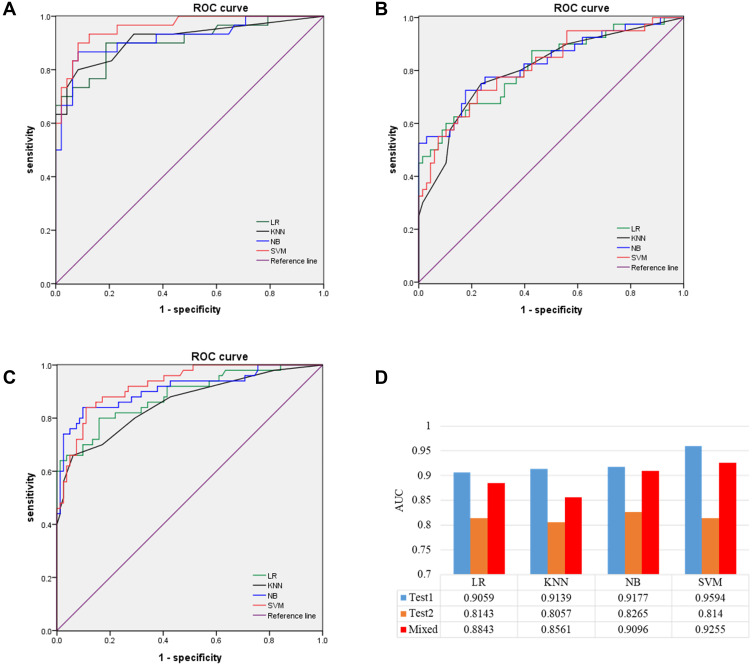
Figure 3.
ROC curves of models in testing sets. (A) Optimal-feature set of LR, KNN, NB, and SVM in test set 1. (B) Optimal feature set of LR, KNN, NB, and SVM in test 2. (C) Optimal-feature set of LR, KNN, NB, and SVM in the mixed test sets. (D) AUC values of optimal-feature subsets for different models in test set 1, test set 2, and mixed test set.

