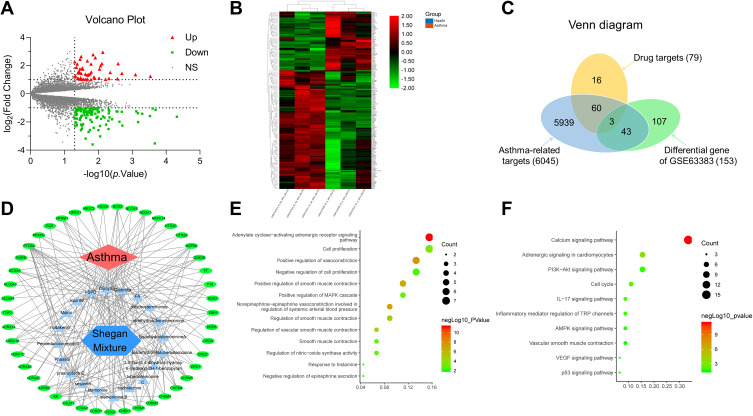
Figure 4.
Screening and prediction of key ingredients and targets using network pharmacology. (A and B) Heatmap and volcano plot of microarray data GSE35643 from the Gene Expression Omnibus (GEO; http://www.ncbi.nlm.nih.gov/geo/) database. (C) Venn diagram of the target source. (D) Network diagram of ingredients and targets between asthma and SGM. (E and F) GO term and KEGG enrichment analysis.

