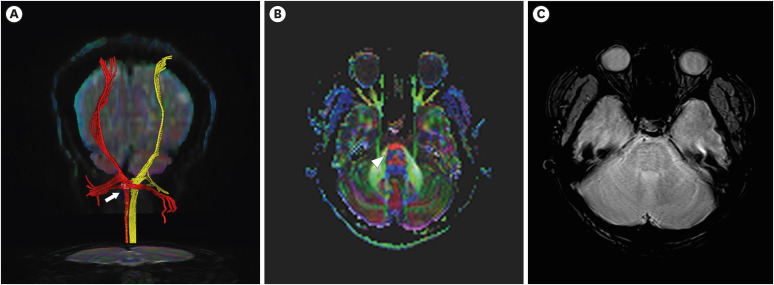
FIGURE 3. (A) Diffusion tensor imaging revealing sharp narrowing of the right CSTs (yellow) at the lower pons level comparing with those of left CSTs (red) Arrow indicates narrowed CSTs on right side. (B) Decreased FA value in the right lower pons and faded blue color (arrowhead) in the right lower pons level on color coded FA map. (C) Axial gradient-echo image.
CST: corticospinal tract, FA: fractional anisotropy.

