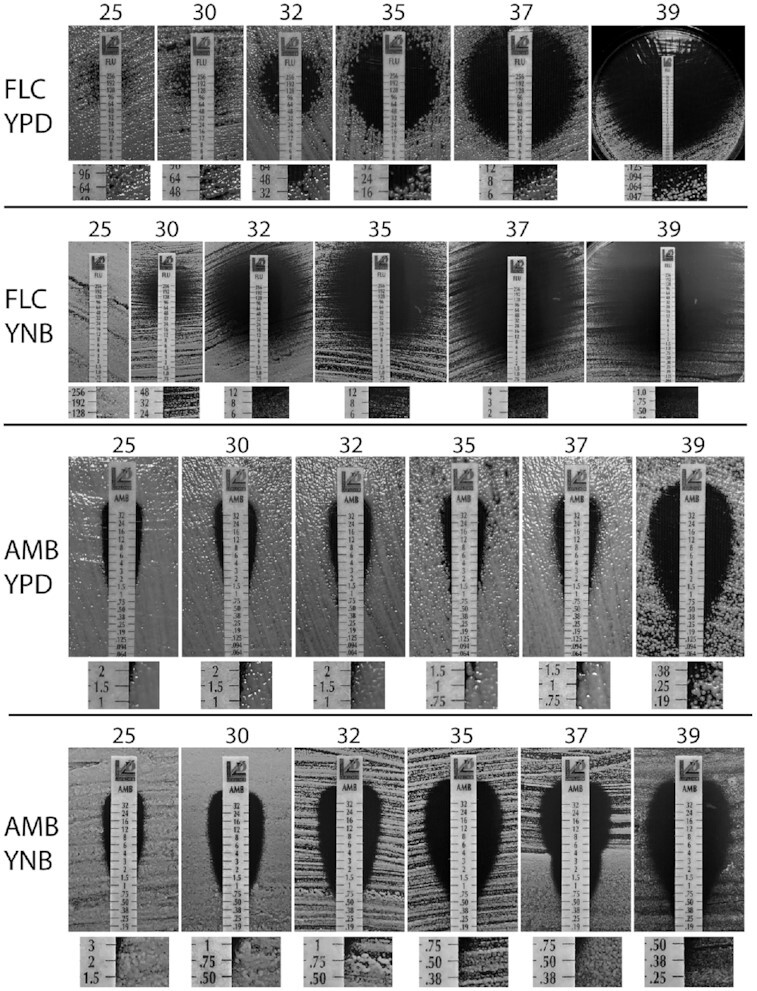
Figure 2.

The effect of temperature on susceptibility towards FLC and AMB. Cells were spread on either YPD or YNB semi-solid media and strips containing concentration gradient of either FLC or AMB were applied to each plate. Plates were imaged after 72 h of incubation at various temperatures (°C), as indicated on top of each panel. Below each panel, a magnified area corresponding to the approximate MIC values is shown.
