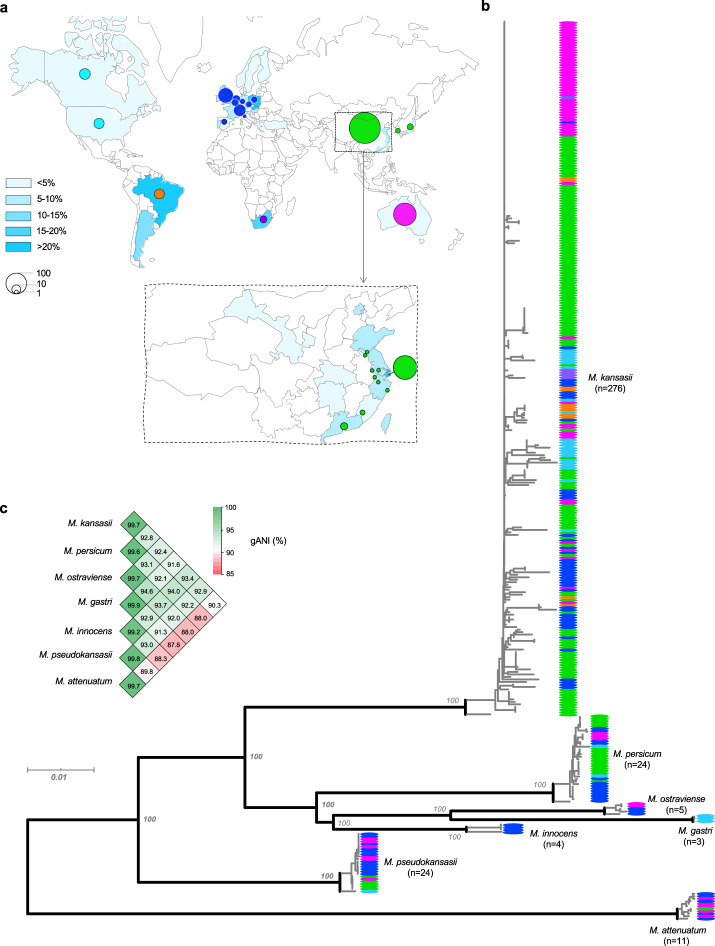
Fig. 1. Global diversity of the M. kansasii complex.
a Geographical distribution of the 358 isolates in the study. The gradient blue colors indicate the prevalence of M. kansasii among NTM disease. b Core genome-based maximum-likelihood phylogeny of the 358 isolates. The colors of the terminal nodes correspond to the geographical origin of individual isolates, as denoted by the circles in (a). c Pairwise genomic average nucleotide identity (gANI) within and between the M. kansasii complex species. Source data are provided as a Source Data file.

