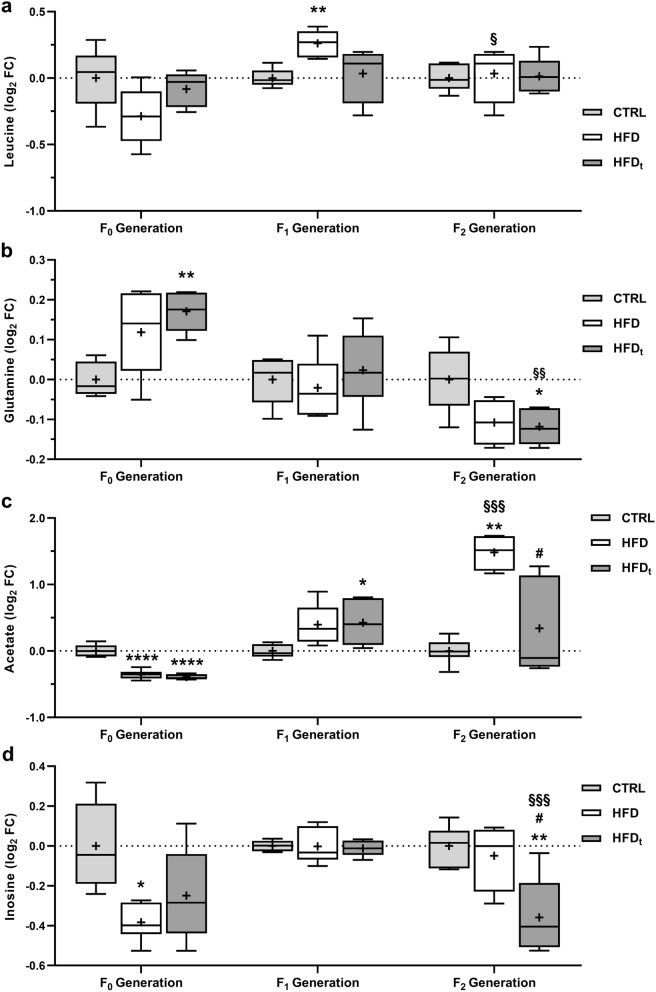
Figure 4.
Testicular metabolites with variations across all generations (n = 6 per group in each generation). (a) Leucine; (b) Glutamine; (c) Acetate and (d) Inosine. Results are expressed as the log2 Fold Change (FC) to the CTRL of the corresponding generation, as Tukey’s whisker boxes (median, 25th to 75th percentiles ± 1.5 Interquartile range). Metabolites were extracted from the testes collected during sacrifice (200 days after mice weaning). Data was tested by univariate ANOVA with Tukey’s HSD for pairwise comparisons. Two-way ANOVA with Šidak correction was used to compare each diet group in F1 Generation against its F2 counterparts. Graphs were obtained using the software GraphPad Prism 8 (San Diego, CA, USA). Pairwise significance was considered when p < 0.05. * vs. CTRL; # vs. HFD; § vs. F1 Generation. Multiple significance signs represent different significance levels: *p < 0.05; **p < 0.01; ***p < 0.001; ****p < 0.0001. + Group mean.

