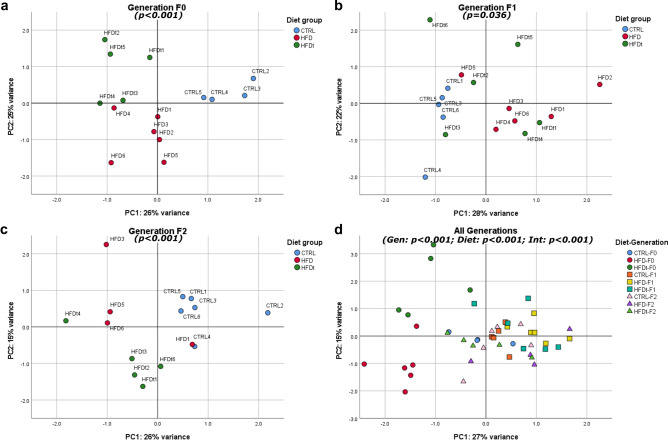
Figure 6.
Sample dispersion in the two-dimensional space spanned by the two principal components extracted by PCA. Animals with at least one missing value in any of the variables considered (sperm parameters and testicular metabolites) were not included in the analysis. All the animals included in the model are represented in the graphs. Significance (p) values refer to overall permANOVA significance, obtained by the vegan R package. Significance was considered when adjusted p < 0.1. PC1 principal component 1, PC2 principal component 2, Gen generation factor, Int interaction (Generation*Diet) factor. PCA data visualization was obtained using the software SPSS 26 (Armonk, NY, USA) and edited using the software Inkscape 1.0 (Boston, MA, USA).

