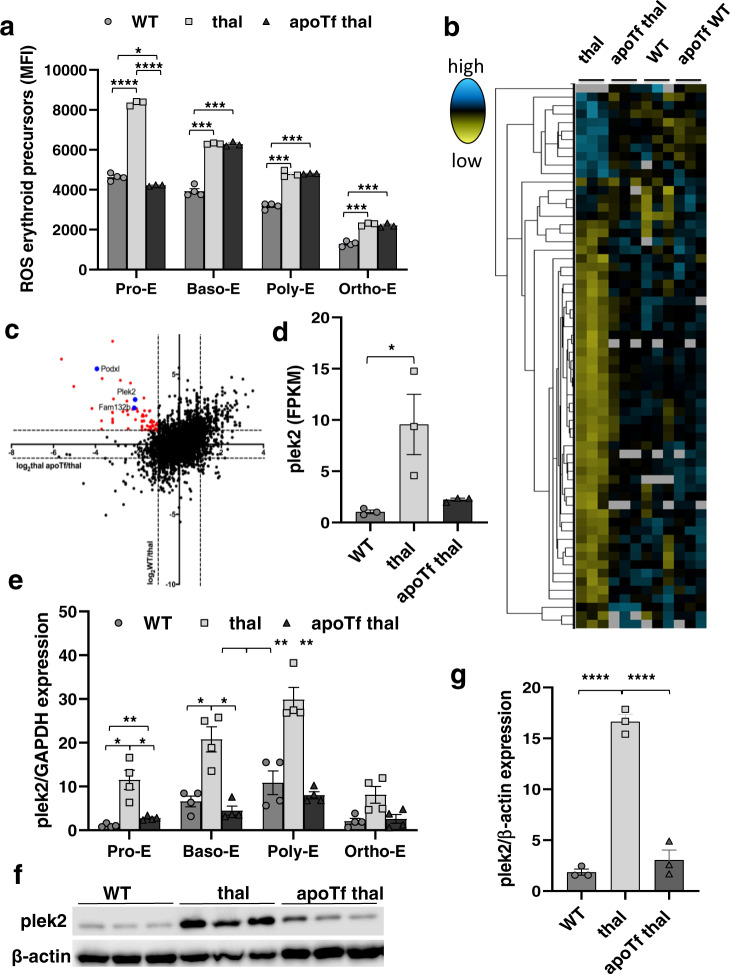
Fig. 1. Pleckstrin-2 is an important marker of ineffective erythropoiesis in β-thalassemic erythroblasts.
a Flow cytometry analysis of MFI of erythroid precursor ROS from WT, β-thalassemic, and apoTf-treated β-thalassemic mice, as identified by CD44 and forward scatter (n = 3-4 mice/group), demonstrating highest ROS in Pro-E stage progressively decreasing during erythroid differentiation, increased ROS at all stages in β-thalassemic relative to WT erythroblasts, and decrease in ROS only in Pro-E stages in apoTf-treated β-thalassemic erythroblasts. b Heatmap of RNA sequencing analysis showing expression levels (FPKM values) of transcripts that display significant differential expression patterns between β-thalassemic and WT Pro-E but correct after apoTf treatment in β-thalassemic mice. Figure represents 2–3 mice pooled per data point, n = 3 data points per group. c Log2-based fold change between comparisons WT/thal vs. thal apoTf/thal were plotted on y vs. x axes, respectively. Red data points represent genes whose expression increases in β-thalassemic relative to WT Pro-E and decreases in β-thalassemic Pro-E after apoTf treatment, revealing several genes of interest, e.g., plek2, and known genes that provide validation, e.g., Fam132b and Podxl. d Relative expression of plek2 from RNA sequencing analysis demonstrates significantly increased plek2 in β-thalassemic bone marrow Pro-E, which partially corrects after apoTf treatment. e Plek2 mRNA expression in sorted bone marrow samples to isolate progressive stages of erythroid differentiation from 2–3 mice pooled per data point, n = 4 data points per group WT, β-thalassemic, and apoTf-treated β-thalassemic mice, demonstrating increased plek2 mRNA expression in all four stages of erythropoiesis in β-thalassemic compared to WT erythroblasts, normalized in apoTf-treated β-thalassemic erythroblasts. f Plek2 protein expression in CD45− bone marrow cells demonstrate increased plek2 in β-thalassemic mice compared to WT, and normalized in apoTf-treated β-thalassemic mice (n = 3 mice/group, MW = plek2 38 kDa, actin 42 kDa). g Statistical analysis of the western blot in (f) for plek2 quantification. All data are reported as mean ± s.e.m. and p < 0.05 is considered statistically significant ((d and g) ordinary one-way ANOVA; (a and e) two-way ANOVA)) (*p ≤ 0.05, **p ≤ 0.005, ***p ≤ 0.0005). WT = wild type; apoTf = apo-transferrin; ROS = reactive oxygen species; MFI = mean fluorescence index; Pro-E = pro-erythroblasts; Baso-E = basophilic erythroblasts; Poly-E = polychromatophilic erythroblasts; Ortho-E = orthochromatophilic erythroblasts; plek2 = pleckstrin-2; FPKM = fragments for kilobase millions.

