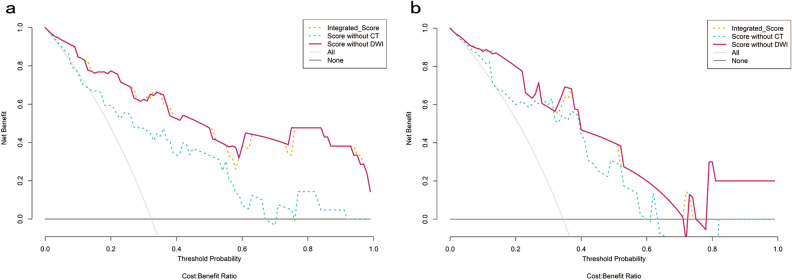
Figure 2.
Decision curve analysis of radiomics models for predicting perineural invasion status. (a) Training dataset; (b) Testing dataset. The y-axis measures the probability of net benefit. The x-axis measures the threshold probability of perineural invasion positive. The red solid curve represents concise score. The blue and yellow dotted curve represents MR score and integrated score, respectively. The grey curve represents the assumption that all perineural invasion status is positive. The black line represents the assumption that all perineural invasion status is negative.

