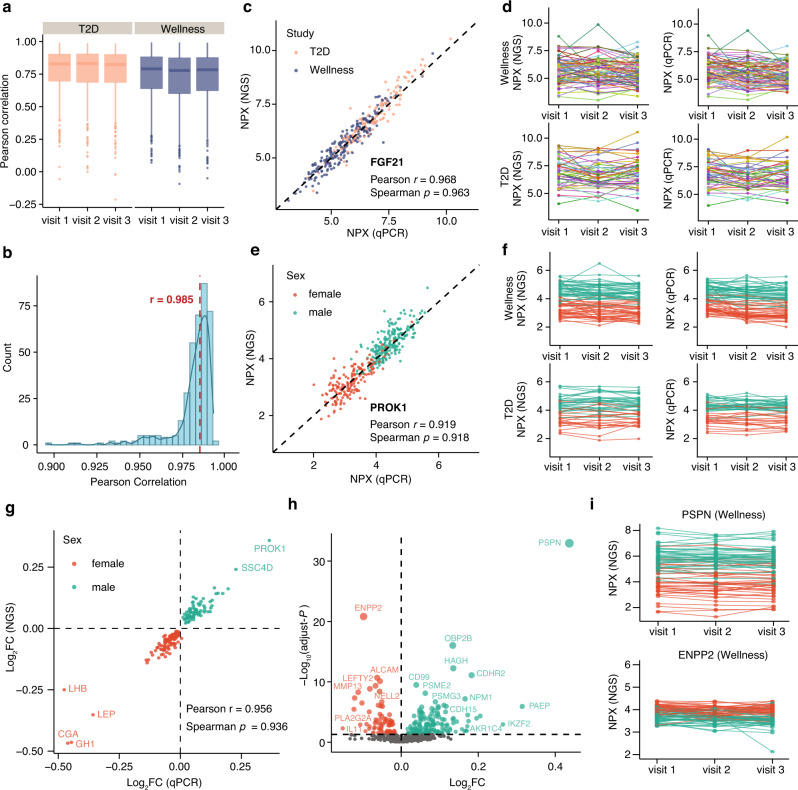
Fig. 2. Correlation between PEA with NGS and qPCR measurements.
a Protein-wise correlation between NGS and qPCR for all proteins analyzed in each visit of the healthy and disease cohorts. Box plots show medians and the 25th and 75th percentiles, whiskers show the largest and smallest values (n = 761 proteins). b A combined boxplot and density plot showing the distribution of the sample-wise correlation values between NGS and qPCR measurements. The red dotted line shows the median Pearson correlation for all samples. c A scatter plot showing the pairwise correlation between the expression levels of NGS and qPCR platforms for the FGF21 protein. d The longitudinal protein profile for FGF21 in wellness and T2D. The color code indicates individuals. e A scatter plot showing the pairwise correlation between the expression levels of NGS and qPCR platforms for PROK1. f The longitudinal protein profile for PROK1 in wellness and T2D. The color code indicates individuals. g A scatter plot showing the pairwise correlation between the fold change in male and female samples measured by NGS and qPCR platforms for sex-related proteins identified in the wellness cohort. h A volcano plot showing the newly identified differentially expressed proteins in male and female samples. The X-axis represents log2 fold-change (FC) and the Y-axis represents log10 (adjusted P values). Differentially expressed proteins were defined as proteins with adjusted P values < 0.05 (three-way balanced ANOVA for gender with age and visit as covariates). Multiple test corrections have been applied for P-values using Benjamini and Hochberg method. i The protein concentration variation across visits one to three, with each individual connected with a dotted line for PSPN and ENPP2 proteins in the wellness cohort. The color code indicates females and males. Source data are provided as a Source Data file.

