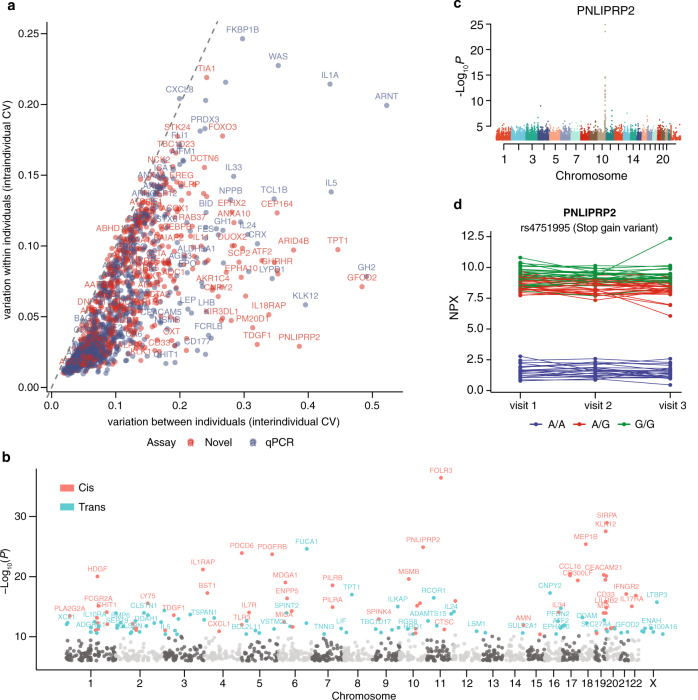
Fig. 3. Variability of the plasma protein profiling and protein quantitative trait loci (pQTL).
a The inter-individual and intra-individual variation of protein levels calculated as the mean coefficient of variation (CV) for each protein within each visit and across all analyzed individuals (n = 76) in the wellness cohort, and as the mean CV for each protein within each individual across all visits (n = 3), respectively. b Manhattan plots of the sentinel pQTL per protein visualizing the cis-pQTLs and trans-pQTLs for all proteins with significant associations. The light and dark grey dots represent the not significant associations split into chromosome location. c Manhattan plot of protein PNLIPRP2 shows the genome locations of all associated pQTLs. d The longitudinal protein concentration across visits one to three with each individual connected with a dotted line for PNLIPRP2, colored by the different variants. Source data are provided as a Source Data file.

