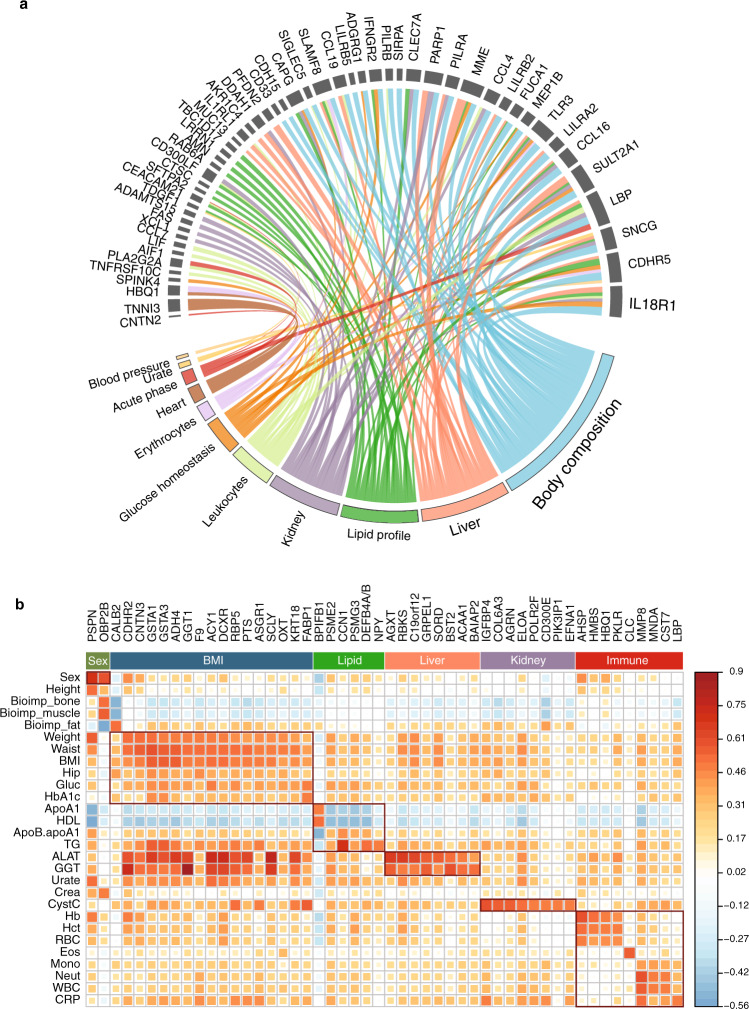
Fig. 4. Associations of proteins with clinical assays.
a Chord diagram presenting the 53 proteins with pQTLs related to clinical measurements. The size of the link is defined as the absolute value of coefficient of the corresponding effect (mixed-effect modeling analysis for each protein and clinical measurement adjusted for gender, age and visit). b A heatmap showing the top 50 proteins most strongly associated with clinical assays based on both wellness and T2D cohorts. Only proteins who are exclusive in the PEA-NGS are listed. See complete results of the pairwise Pearson correlation values between all proteins and clinical assays in Supplementary Data 7. Source data are provided as a Source Data file.

