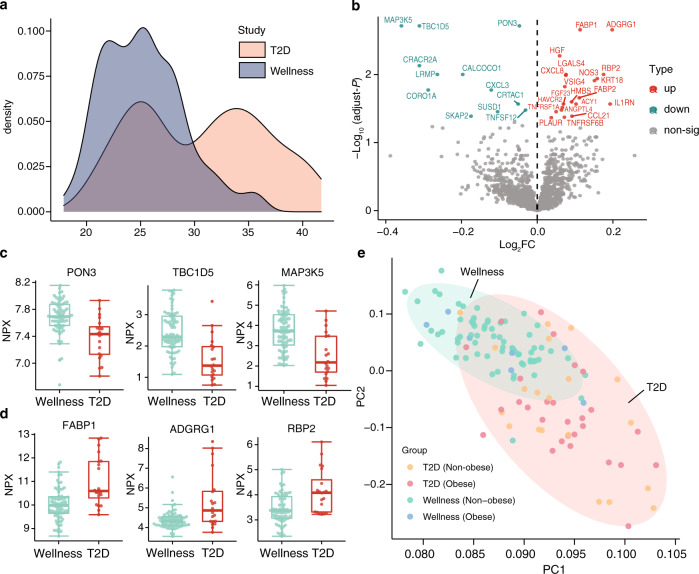
Fig. 5. Plasma proteins associated with type 2 diabetes.
a The distribution of body mass index (BMI) in the two cohorts. b A volcano plot showing the differentially expressed proteins at baseline in the non-obesity group in T2D and wellness cohorts. The X-axis represents log2 fold-change (FC) and the Y-axis represents log10 (adjusted P-values). Differentially expressed proteins were defined as proteins with adjusted P-values < 0.05 (two-way balanced ANOVA for study cohort with gender as covariate). Multiple test corrections have been applied for P-values using Benjamini and Hochberg method. c Three examples of the upregulated proteins in the non-obesity T2D patients compared to the non-obesity healthy individuals in the wellness cohort. Box plots show medians and the 25th and 75th percentiles, whiskers show the largest and smallest values (n = 89 samples), error bars represent mean ± SD. d Three examples of the down-regulated proteins in the non-obesity T2D patients. e PCA results presenting the expression patterns of healthy and disease individuals at baseline based on the protein profiles of differentially expressed proteins between the non-obesity groups in T2D and wellness cohorts. Source data are provided as a Source Data file.

