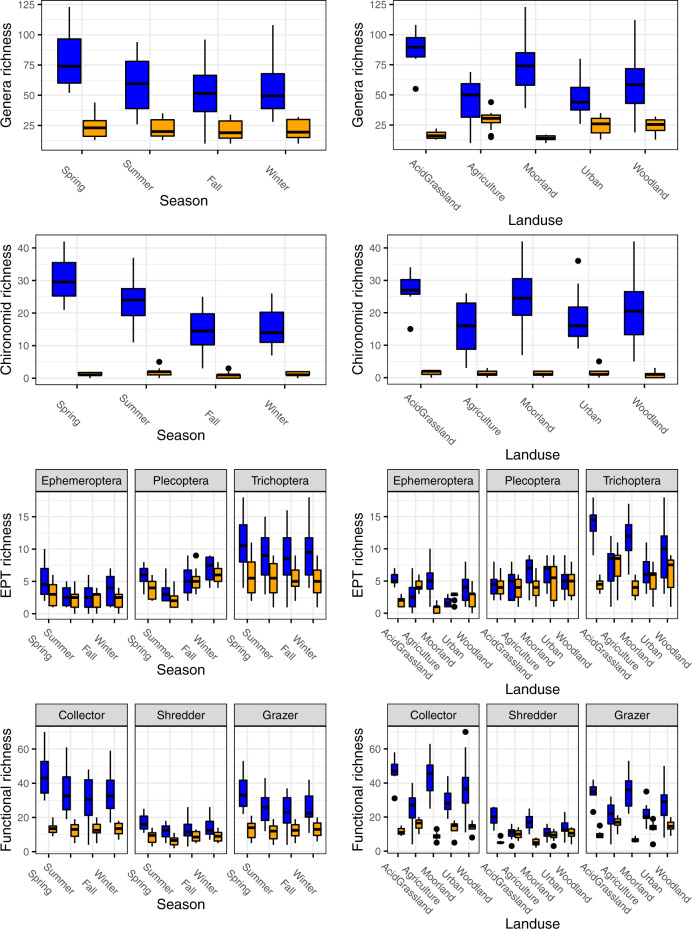
Fig. 4. Genera, Chironomidae, EPT and functional spato-temporal richness patterns for eDNA and traditional methods.
Box plots showing the richness diversity per season (left panels), and landuse (right panels) for genera (top), Chironomidae (second from the top), EPT (second from the bottom) and functional diversity (bottom). Blue indicates eDNA derived data and orange indicates traditional method derived data. Error bars are drawn to 1.5 * inter-quartile range (IQR), with outlier points being the data outside the 1.5 * IQR range. Sample sizes were 56 for eDNA (average of each sites’ 3 replicate samping) and 56 for traditional sampling.

