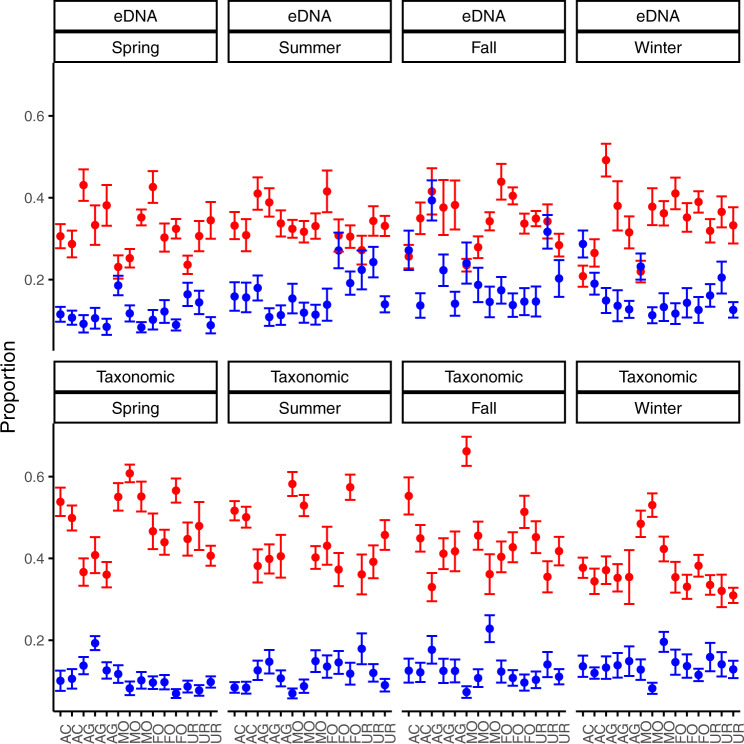
Fig. 5. Beta-diversity partitioning of traditional and eDNA biodiversity.
Beta-diversity results partitioned into turnover (red) and nestedness (blue) components. Showing differences between methods (eDNA vs Taxonomic), season (Spring, Summer, Fall, Winter), with each site provided along the x-axis indicating its landuse type (AC = acid grassland, AG = agriculture, MO = moorland, FO = forest, UR = urban). Error bars are drawn to 1.5 * inter-quartile range (IQR). Turnover was significantly greater than nestedness across landuse and seasons (p < 0.001), following a gls model that accounted for spatial autocorrelation in its variance structure via a pairwise distance matrix. Sample sizes were 56 for eDNA (average of each sites’ 3 replicate samping) and 56 for traditional sampling.

