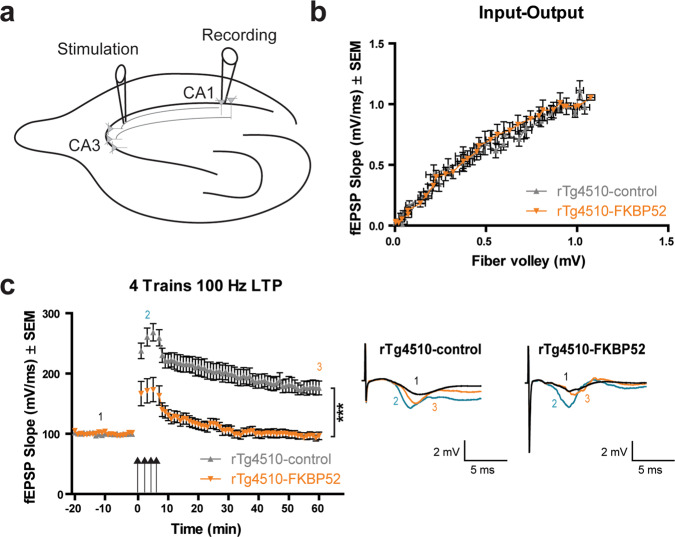
Fig. 5. FKBP52 overexpression induces deficits in hippocampal LTP.
a Schematic of the long-term potentiation (LTP) protocol in ex vivo hippocampal slices from rTg4510 mice infused with AAV9-control or AAV9-FKBP52. Stimulating electrode was positioned in the Schaffer collaterals (between CA3 and CA1) and recordings were obtained in the CA1 pyramidal neurons. b Input–Output (I–O) curve to evaluate pre- and postsynaptic excitatory function. The I–O curve compares the fEPSP slope (mV/ms) versus the fiber volley amplitude (mV). c Four-trains of high-frequency stimulation (HFS) at 100 Hz were given to induce LTP (indicated by the arrows). Following this, field EPSPs were measured for 60 min. Representative traces are shown on the right. Significance was determined by repeated measures two-way ANOVA (***p < 0.001). Data are shown in standard error of the mean (±SEM). n = 23 for rTg4510-control and n = 12 for rTg4510-FKBP52. Representative traces are shown as 1 (black) indicates baseline, 2 (teal) indicates initial early LTP in the first minute following HFS, and 3 (orange) indicates late LTP in the last 60 min of recording. fEPSP field excitatory postsynaptic potential, min minutes, CA1 CA3 Cornu Ammonis 1, 3, LTP long-term potentiation, mV millivolts, ms milliseconds, Hz hertz.

