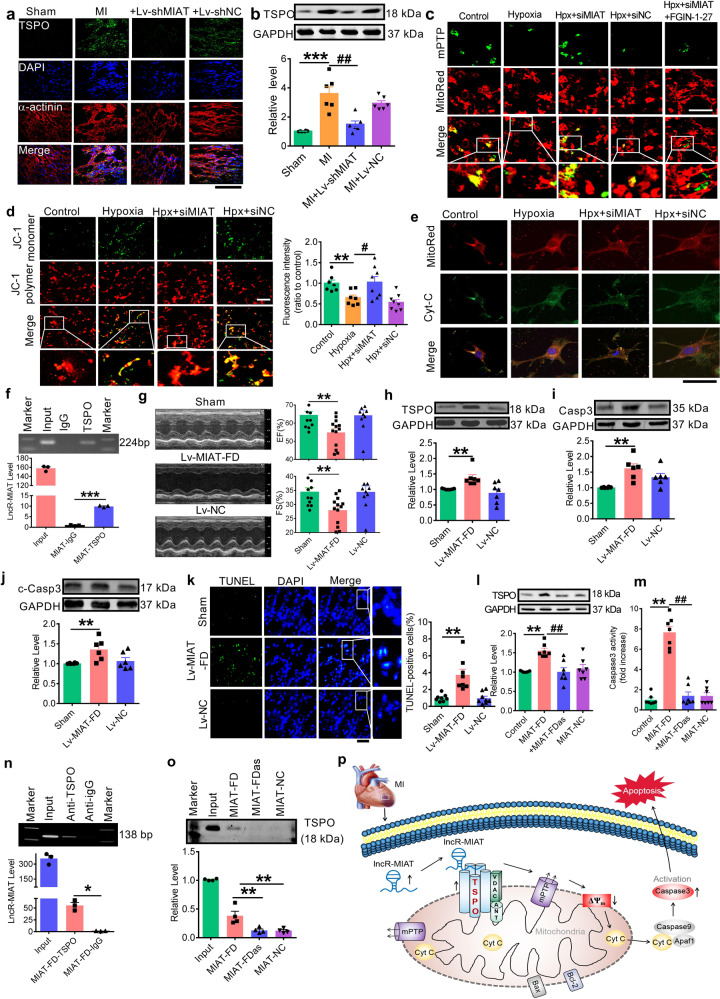
Fig. 1.
a Representative images of immunofluorescence staining of mitochondrial translocator protein (TSPO in green) expression in heart tissue sections of MI mice (600× magnification). DAPI staining was used for identifying nucleus and α-actinin staining for cardiac muscles. Note that MI induced substantial expression of TSPO, which was suppressed by lentivirus vector carrying a short RNA sequence targeting long non-coding RNA lncR-MIAT (Lv-shMIAT) to silence endogenous expression of lncR-MIAT in vivo with Lv-shNC as a negative control. b Upregulation of TSPO protein level in MI hearts and restoration of this upregulation by Lv-shMIAT, but not by Lv-shNC, as assessed by Western blot analysis. ***P < 0.001 vs. Sham; ##P < 0.01 vs. MI; n = 5–6. c Typical examples of calcein-AM staining (200× magnification) showing the changes of opening of mitochondrial permeability transition pore (mPTP) in cultured neonatal mouse ventricular cells (NMVCs). mPTP was stained in green, and the loss of staining indicates the opening of mPTP. Note that hypoxia triggered opening of mPTP, and this change was reversed by lncR-MIAT siRNA (siMIAT) to knockdown endogenous lncR-MIAT in vitro, but not by siNC as a negative control construct for siMIAT, which was blocked by the addition of TSPO activator FGIN-1-27. MitoRed staining was used to localize mitochondria. d Left panel: representative images (200× magnification) of JC-1 staining depicting the changes of the mitochondrial membrane potential in NMVCs. The green staining of JC-1 monomer seen under hypoxic conditions indicates depolarization of mitochondrial membrane potential, and the red staining of JC-1 polymer marks mitochondria. Right panel: mean ± SEM of the intensity of JC-1 monomer staining showing the restoration of the hypoxia-induced depolarization of mitochondrial membrane potential by siMIAT. **P < 0.01 vs. Control; #P < 0.05 vs. Hypoxia; n = 7–8. e Representative images of immunofluorescent staining (600× magnification) for cytochrome c (Cyt-C) in NMVCs. Cyt-C (green) was restricted within the rod-shaped bodies stained in red by MitoRed, indicating its colocalization to mitochondria under normoxic conditions. Under hypoxia, the distribution of Cyt-C became diffused throughout the cytoplasm indicting its release from mitochondria, which was effectively prevented by siMIAT. f A representative image of RIP assay showing the immunoprecipitation of lncR-MIAT by TSPO antibody. The bottom panel provides the statistical data (mean ± SEM) on the level of lncR-MIAT immunoprecipitated with TSPO antibody determined by qPCR. IgG was used as a negative control, and the data were normalized to IgG. Input was used as a positive control. ***P < 0.001 anti-TSPO vs. anti-IgG; n = 3. g Overexpression of a 226-nt fragment encompassing the highly conserved sequence region of lncR-MIAT (MIAT-FD for functional domain of lncR-MIAT) by infection of lentivirus carrying MIAT-FD (Lv-MIAT-FD) in healthy mice caused cardiac dysfunction, as reflected by the decreased EF% and FS%. **P < 0.01 vs. Sham; n = 10–13. h Western blot analysis showing the increased TSPO expression at the protein level with overexpression of MIAT-FD elicited by Lv-MIAT-FD, but not by its negative control construct Lv-NC (scrambled negative control). **P < 0.01 vs. Sham; n = 7. i Overexpression of MIAT-FD upregulated the protein level of total caspase3 (Casp3), relative to sham-operated control and Lv-NC-treated control mice. **P < 0.01 vs. Sham; n = 6. j Overexpression of MIAT-FD upregulated the protein level of cleaved caspase3 (c-Casp3), relative to sham-operated control and Lv-NC-treated control mice. **P < 0.01 vs. Sham; n = 6. k Representative images of TUNEL staining of mouse myocardial sections for apoptotic cells (200× magnification). Note that overexpression of MIAT-FD in healthy mice infected with Lv-MIAT-FD, but not with Lv-NC, robustly increased the TUNEL-positive cells. Apoptotic cells were semi-quantified and expressed as the percentage of TUNEL-positive cells over DAPI stained cells. **P < 0.01 vs. Sham; n = 8. l Western blot results showing the significant elevation of TSPO protein level in NMVCs transfected with MIAT-FD and the reversal of TSPO deregulation by co-transfection of the antisense oligo fragment of MIAT-FD (MIAT-FDas). MIAT-NC: the negative control for MIAT-FD. **P < 0.01 vs. Control; ##P < 0.01 vs. MIAT-FD; n = 7. m Forced expression of MIAT-FD robustly increased caspase3 activity in NMCMs as determined by caspase3 assay kit. This detrimental effect of MIAT-FD was abrogated by MIAT-FDas. MIAT-NC showed no effects on caspase3 activity. **P < 0.01 vs. Control; ##P < 0.01 vs. MIAT-FD; n = 7. n RNA immunoprecipitation (RIP) analysis showing the precipitation of MIAT-FD by TSPO antibody with IgG as a negative control. Input: positive control. *P < 0.05 anti-TSPO vs. anti-IgG; n = 3. o RNA pulldown analysis showing the pulldown of TSPO protein by MIAT-FD, but not by MIAT-FDas or MIAT-NC. Input: positive control. **P < 0.01 vs. MIAT-FD; n = 4. p Schematic diagram depicting the proposed signaling mechanisms of lncR-MIAT in the setting of MI: MI → lncR-MIAT ↑ → TSPO ↑ → mPTP opening ↑ → ΔΨm ↓ → Cyt-C release ↑ → c-Casp3 ↑ → apoptosis ↑

