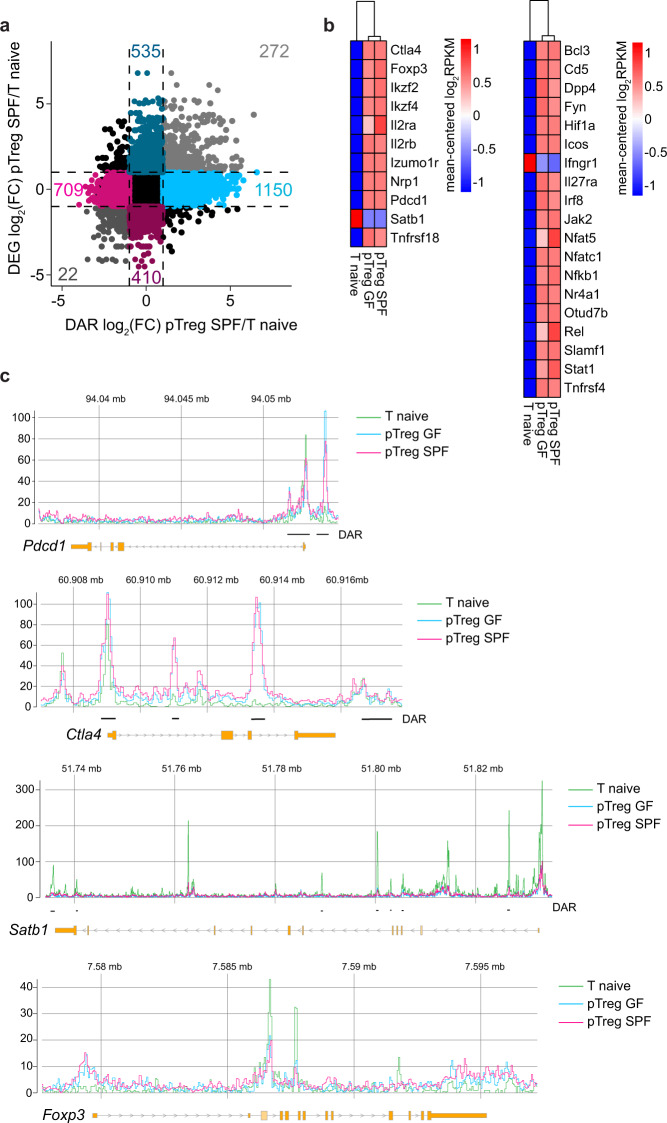
Fig. 5.
Treg signature genes are upregulated at early stages of pTreg induction. De novo induced Foxp3hCD2+ pTregs among adoptively transferred CD4+OvaTCR+ T cells were isolated from mLNs of GF and SPF-housed mice after Ova immunization, and CD62L+CD4+OvaTCR+ naive T cells were freshly isolated from Foxp3hCD2xRag2−/−xDO11.10 mice. RNA-seq and ATAC-seq analyses were performed. DEGs and DARs in the TSS were identified in colonization- (SPF vs. GF) and cell-type-dependent (pTregs vs naive T cells) pairwise comparisons (log2(FC) ≥ 1, q-value ≤ 0.05). a Scatterplot comparing the gene-wise fold change of the chromatin accessibility and transcriptome between SPF pTregs/naive T cells. On the x-axis, log2(FC) of mean fold change of DARs per gene, and on the y-axis, log2(FC) of gene expression are plotted. Colored numbers in the scatterplot represent the number of genes in the indicated quadrant. b Heatmaps depict signature Treg genes across all experimental groups (left) and genes involved in NF-κB, T cell receptor, NFAT and interferon signaling (right). c Genome tracks depict mean-replicate values of ATAC-seq FPKM for Foxp3, Clta4, Satb1, and Pdcd1. Datasets are group-normalized to maximum peak height, as indicated on the y-axis. Highlighted DARs are significant for at least one pairwise comparison. Samples for both ATAC-seq and RNA-seq were pooled from two independent experiments (n = 2–4). ATAC, assay for transposase accessible chromatin; DAR, differentially accessible region; DEG, differentially expressed gene; FC, fold change; FPKM, fragments per kilobase of peak per million reads; GF, germ-free; mLNs, mesenteric lymph nodes; Ova, ovalbumin; pTregs, peripherally induced regulatory T cells; RPKM, reads per kilobase of exon length per million reads; SPF, specific pathogen-free; TCR, T cell receptor; TSS, transcriptional start site

