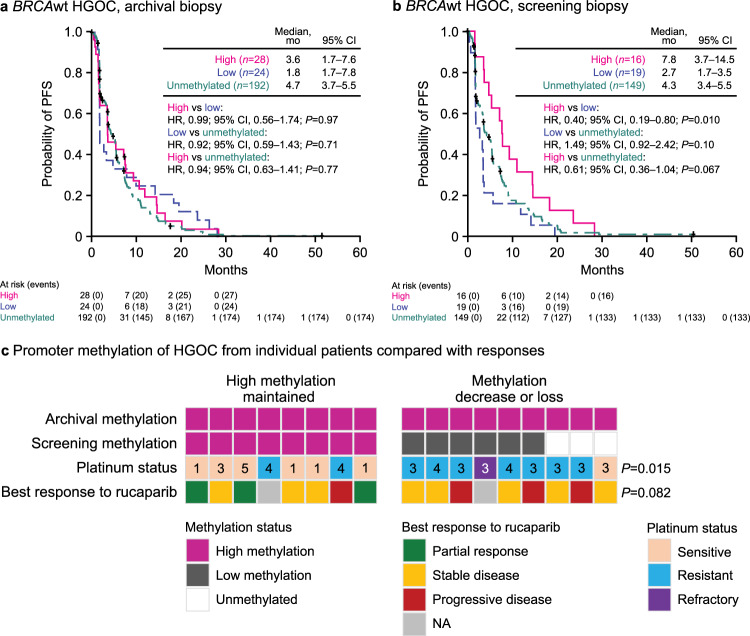
Fig. 3. High BRCA1 methylation levels at screening are associated with better outcomes.
a Kaplan–Meier plot showing PFS in ARIEL2 patients with BRCAwt HGOC having high (magenta), low (blue), or no methylation (unmethylated, teal) in archival biopsy. b Kaplan–Meier plot showing PFS in ARIEL2 patients with BRCAwt HGOC having high (magenta), low (blue), or no methylation (unmethylated, green) in screening biopsy. P values in panels a and b are based on Cox proportional hazard model. c Methylation status at screening as compared to the archival sample, platinum status, and best response to rucaparib of 17 HGOC with high BRCA1 methylation levels in the archival sample and an available matched screening biopsy; numbers indicate number prior lines of chemotherapy treatment; P values are based on a two-sided Fisher’s exact test testing the proportion of patients with platinum status of sensitive and best response of partial response between HGOC that maintained methylation vs decrease or loss of methylation. BRCA BRCA1 or BRCA2, CI confidence interval, HGOC high-grade ovarian carcinoma, HR hazard ratio, NA not applicable, PFS progression-free survival, wt wild type.

