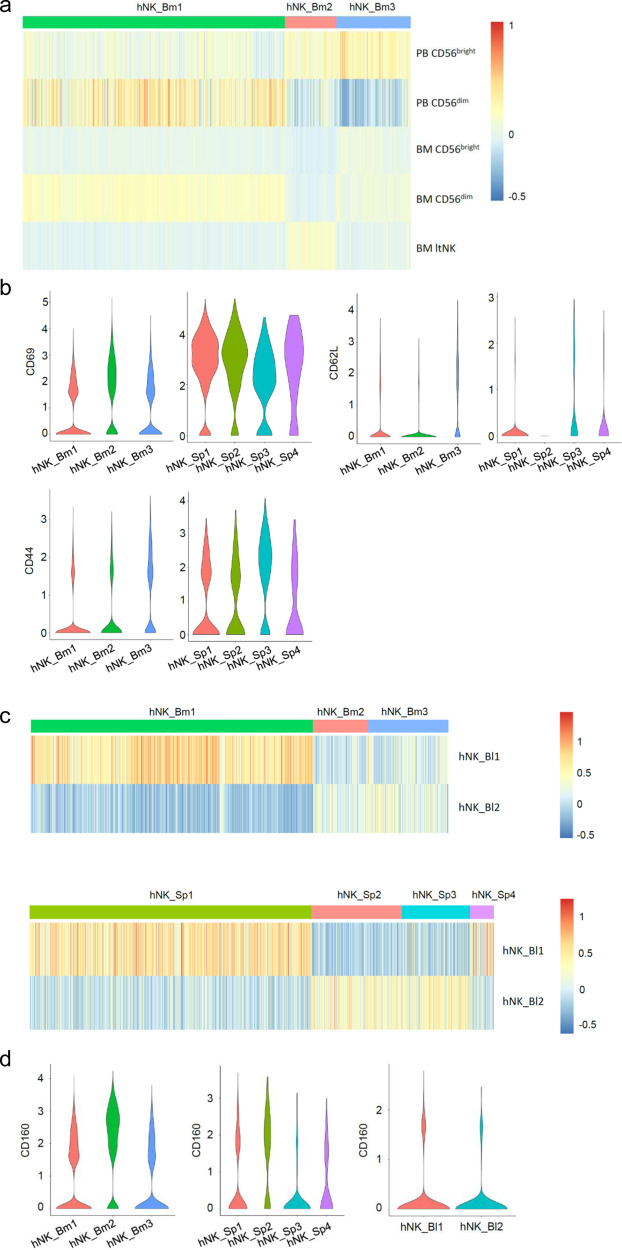
Fig. 1.
a Heatmap showing the hNK_Bm1, hNK_Bm2, and hNK_Bm3 gene expression profiles of peripheral blood (PB) NK cells from Hannah et al.6 and for bone marrow (BM) NK cells from Melsen et al.7 b Violin plot representing the distribution of module scores for CD69, CD62L, and CD44 for each indicated NK cell subset grouped by tissue of origin. c Heatmap showing the hNK_Bl1 and hNK_Bl2 gene expression profiles of each of the three healthy human bone marrow and the four splenic NK cell subsets. d Violin plot representing the distribution of the module score for CD160 for each indicated NK cell subset grouped by tissue of origin.

