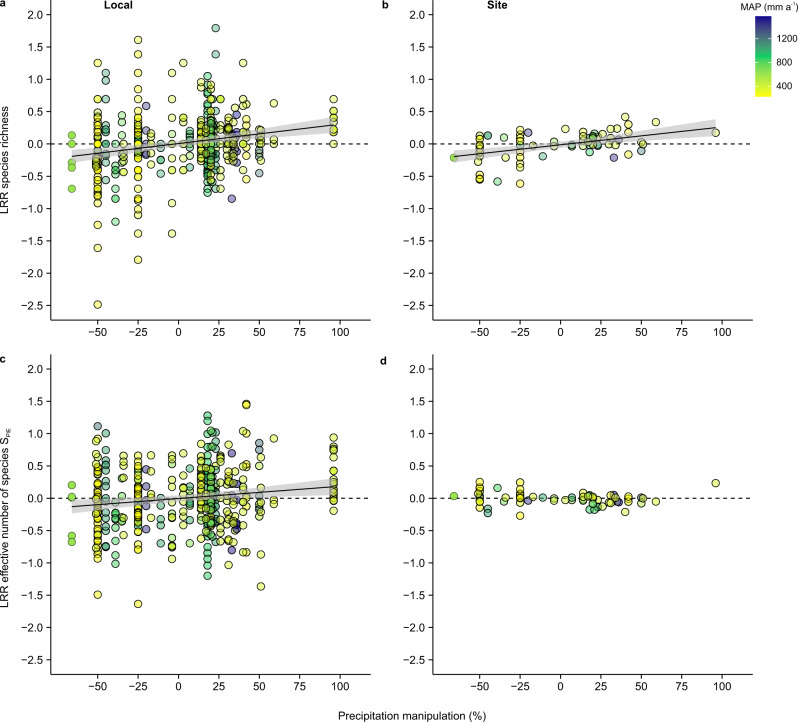
Fig. 1. Responses of plant diversity to precipitation manipulation at local and site scales.
Effect of the magnitude of precipitation manipulation on the log response ratio (LRR) of species richness (a, b) and effective number of species—SPIE c, d) at the local scale (i.e., plot scale; a, c) and site scale (b, d). Data points represent log response ratios of original data (n = 462 at the local, n = 72 at the site scale) and colors indicate the background mean annual precipitation (MAP). The linear regressions (mean and 95% confidence intervals) are based on predicted values of the simplest linear mixed effect model including magnitude of precipitation manipulation (Supplementary Tables 2 and 3).

