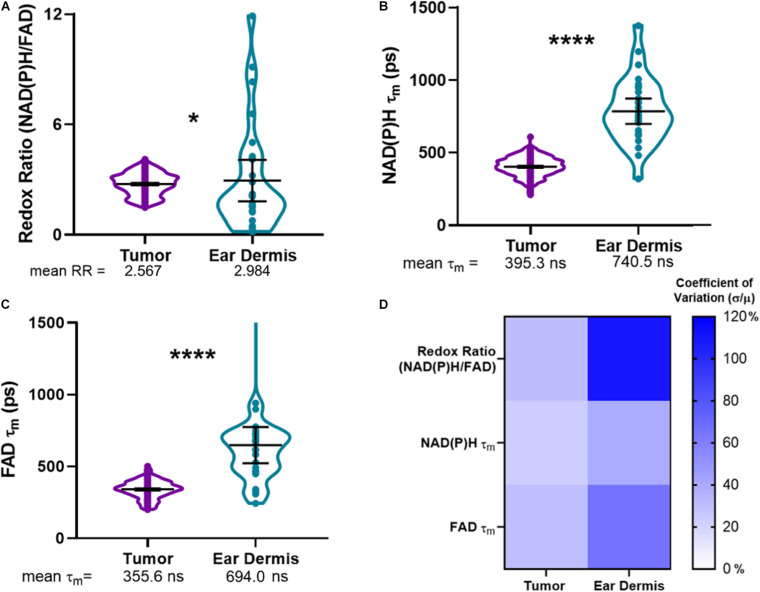
FIGURE 3.
Metabolic autofluorescence resolves differences between tumor and dermal macrophages. (A–C) Violin plots show the full distributions of optical redox ratio (RR), NAD(P)H τm, and FAD τm measured from individual macrophages in tumor and dermal tissues. Mean ± 95% confidence intervals for each measurement are represented by thick black lines and error bars, respectively, overlaid on the violin plots. (A) Quantitative single-cell analysis of redox ratio reveals that tumor-infiltrating macrophages are more oxidized than non-malignant dermal macrophages (2.567 ± 0.53 tumor RR vs. 2.984 ± 0.905 dermis RR). Additionally, mean lifetimes (τm) of (B) NAD(P)H and (C) FAD are lower in tumor-infiltrating macrophage populations compared to non-malignant dermal macrophages. (*, ****p < 0.05, 0.0001; n = 4 mice, 836 cells – tumor; 52 cells – ear dermis). (D) Heatmap of coefficients of variation for autofluorescence variables demonstrate macrophage heterogeneity across both tissues, with the greatest variation observed across ear dermis macrophages. Percent coefficients of variation were calculated as the measurement standard deviation (σ) divided by the measurement mean (μ) multiplied by 100 for each variable and tissue type.

