Figure 3.
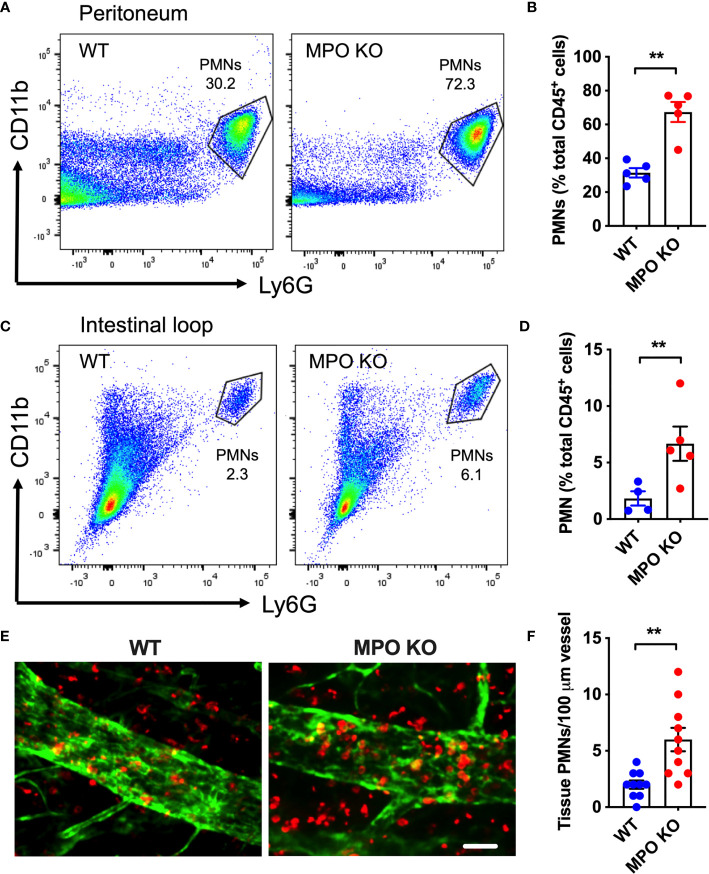
MPO KO PMNs exhibit elevated migratory efficiency. Two in vivo PMN models were used to assess the migratory efficiency of WT and MPO KO PMNs. (A, B) Zymosan-induced peritonitis model was used. (A) Representative flow diagrams of lavaged PMNs that have migrated into the peritoneal cavity and (B) Quantification demonstrate enhanced PMN migration in the absence of MPO. (C–F) Intestinal loop model, where PMN migration into the lumen of ligated intestinal segments is induced by intraluminal CXCL1 administration was used to assess the impact of MPO on PMN migration. (C) Representative flow diagrams of lavaged luminal PMNs and (D) Quantification revealed consistently increased PMN tissue infiltration in MPO knockout mice. (E) Representative fluorescence images of intestinal whole mount tissue following lavage, stained for PMNs (red, S100A8) and ECs (green, CD31) and (F) Quantification similarly depict increased PMN infiltration in MPO KO mice. The bar is 50µm. N=5-7 mice per condition. **p < 0.01.

