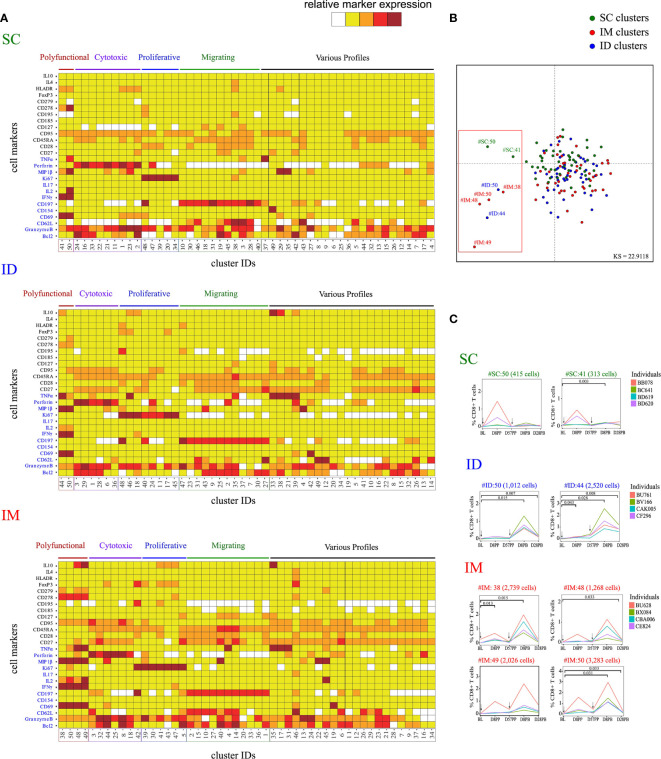
Figure 2.
Characterization of the impact of the SC/ID/IM routes on CD8+ T-cell phenotypic cluster diversity by mass cytometry. (A) Categorical marker expression heatmap representing the phenotypes of CD8+ T cells for each administration route. SPADE analysis was performed for each administration route based on the entire cell set according to the gating strategy described in Figure S1 . Markers in blue were used as clustering markers in the SPADE analyses. Cell clusters were organized into families by hierarchical clustering. The five-tiered color scale, from white to deep red, represents relative marker expression. (B) Two-dimensional MDS representation showing the phenotypic differences and similarities between cell clusters identified by each SPADE analysis. Phenotypic similarities were quantified based on the mean signal intensity of the 13 SPADE clustering markers. Red square indicate the eight singular cell cluster (C) Charts showing changes in the percentage of CD8+ T cells over time for the selected marginal clusters. Black arrows indicate the days of vaccine injection. BL, baseline; D, day; PP, post-prime; PB, post-boost.

