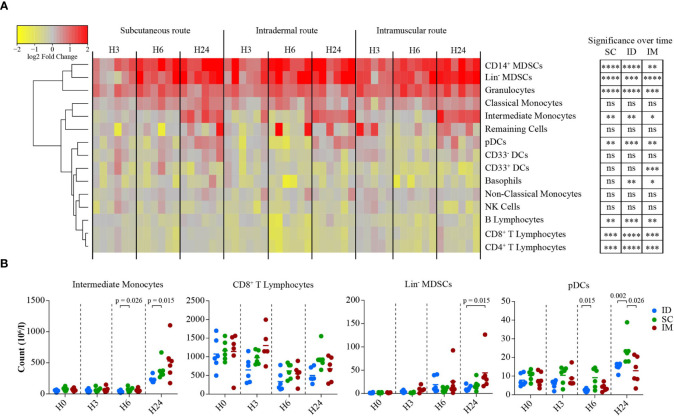
Figure 4.
Impact of the SC/ID/IM routes on early systemic immunity. (A) Heatmap representation showing the changes in cell abundance (in log2 fold change) of populations characterized by flow cytometry in the blood 3, 6, and 24 h after SC/ID/IM MVA injection. Populations were organized based on their cell abundance by hierarchical clustering and are represented by a dendrogram. Changes in cell abundance of each population were normalized and are represented by a color-gradient scale ranging from yellow to red. Significant changes over time are indicated on the right (B) Scatter plot showing the kinetics of changes in cell abundance for selected cell populations. Each dot represents one single biological sample. ns, non-significant; *0.05 > p > 0.01; **0.01 > p > 0.001; ***0.001 > p > 0.0001; ****p < 0.0001.

