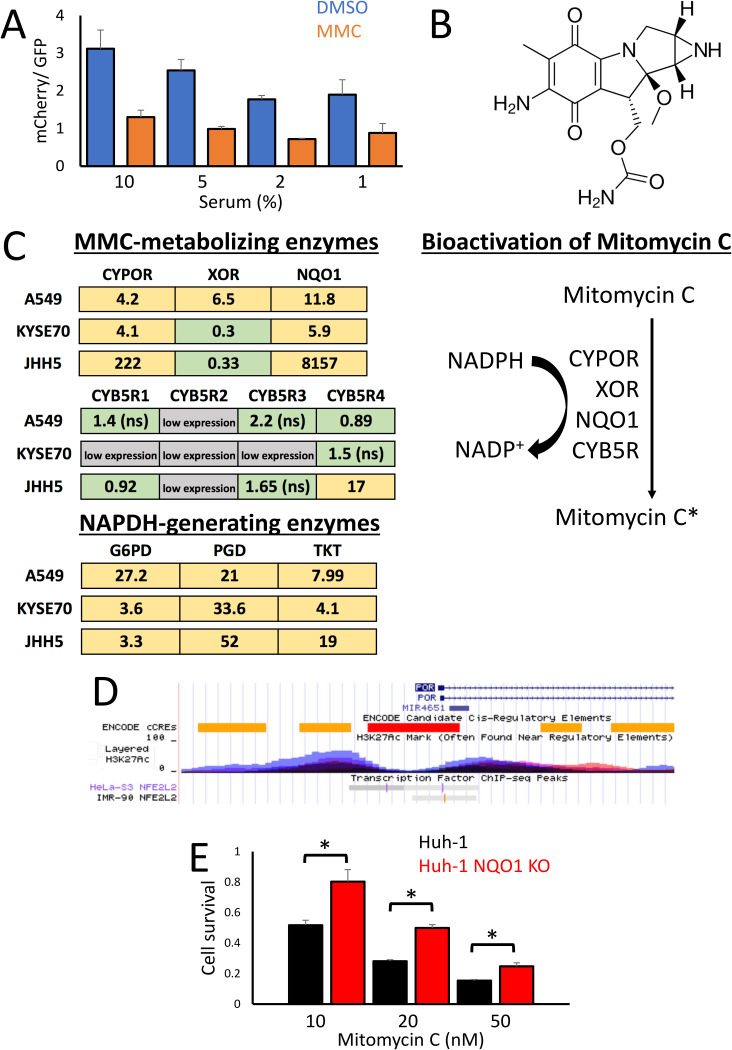
FIG 4.
Multiple NRF2 target genes are responsible for the enhanced bioactivation of mitomycin C. (A) Ratio of mCherry/GFP fluorescence from cocultured WT-GFP and Keap1 KO-mCherry cells after 8 days treatment with either 0.1% DMSO or 100 nM mitomycin C, cultured in media containing the indicated percentages of growth serum. (B) Chemical structure of mitomycin C. (C) Fold induction of enzymes involved in the bioactivation of mitomycin C in NRF2-activated relative to wild-type cell lines. The enzymes CYPOR, XOR, NQO1, and CYB5R directly metabolize mitomycin C into the DNA-damaging agent mitomycin C*, with the pentose phosphate pathway generated NADPH providing the reducing equivalents for the bioactivation reactions. The data for A549 cells (NRF2 active) are shown as fold induction over COR-L105, KYSE70 as fold induction over KYSE30, and JHH5 as fold induction over JHH2 cells. The yellow color represents a statistically significant increase in gene expression, and green represents no significant change. Low expression, in gray, indicates a qPCR threshold cycle (CT) value of more than 15 above the GAPDH (glyceraldehyde-3-phosphate dehydrogenase) control. ns, not significant. (D) ChIP-Seq data of the human CYPOR (also named POR) locus on chromosome 7, taken from the UCSC genome browser. The ChIP-Seq tracks for NRF2 (also named NFE2L2) from HeLa-S3 and IMR-90 cells show binding sites in the histone H3K27Ac-marked enhancer regions adjacent to the CYPOR promoter. (E) Relative cell survival of Huh-1 cells, determined by total protein content, exposed to the indicated concentrations of mitomycin C for 8 days, compared to the isogenic NQO1 KO cell line generated using CRISPR-Cas9.

