FIG 4.
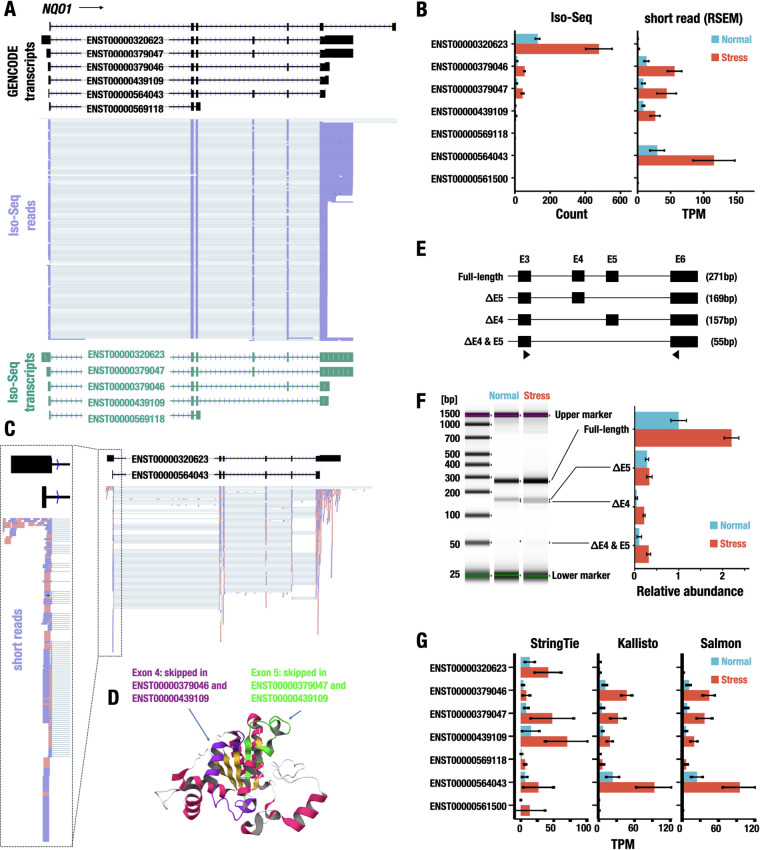
Estimation of transcript isoforms of the NQO1 gene. (A) Representative Iso-Seq reads aligned to the NQO1 gene. The transcript structures in the GENCODE database are represented with black (GENCODE transcripts). The reads of Iso-Seq analysis are shown in purple (Iso-Seq reads). The transcript models made from Iso-Seq data are shown in green (Iso-Seq transcripts). The ensemble IDs are shown on the transcript models. (B) Expression levels of transcript isoforms of the NQO1 gene detected by Iso-Seq (left) and short-read-based RNA-Seq (right). The expression levels under normal (blue) and stress (red) conditions are shown. Data represent the means ± SD. (C) Representative sequence reads aligned to the NQO1 gene. The transcript structures in the GENCODE database are represented with black boxes and lines representing exons and introns, respectively. The short reads aligned to the NQO1 locus are shown with pink and purple, indicating reads aligned to the plus strand and the minus strand, respectively. The ensemble IDs are shown on the transcript models. (D) Mapping of skipped exons on the protein structure of NQO1. Exons 4 and 5 are shown in purple and green, respectively. (E) RT-qPCR validation of transcript isoforms of the NQO1 gene identified by the Iso-Seq analysis. The full-length transcript and transcript isoforms with exon skipping of exon 4, exon 5, or both are shown. RT-qPCR analysis for the detection of NQO1 isoforms was performed using primers in exon 3 and exon 6 (triangles). The expected amplicon sizes obtained from each transcript isoform are shown in parentheses. (F) The relative abundance of the NQO1 isoforms. Representative electrophoresis image obtained from the RT-qPCR analysis is shown on the left. Relative abundance of the isoforms under normal and stress conditions is shown on the right. Data represent the means ± SD. (G) Quantification of transcript isoforms of the NQO1 gene using StringTie, Kallisto, and Salmon software under normal and stress conditions. The values are shown as the means ± SD.

