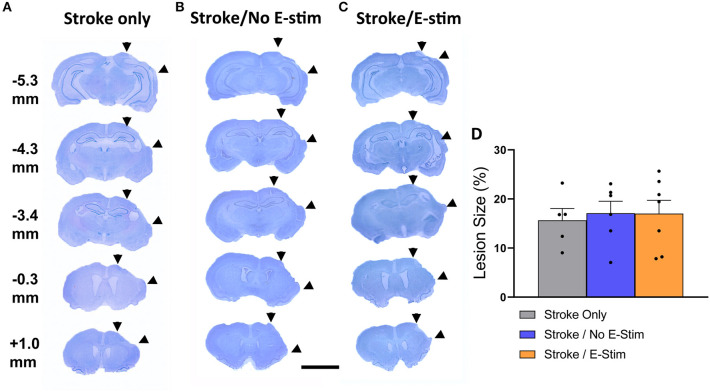
Figure 3.
Lesion analysis. Nissl stain sections and their relative distance from bregma showing typical ischemic lesion of all three groups of rats (A–C). Area between two arrowheads on each brain section indicates stroke-induced necrotic regions. The numbers indicate relative distance to bregma. The scale bar indicates 0.5 cm. (D) Lesion analysis showed no difference in the lesion size between groups (Stroke only vs. Stroke/No e-stim vs. Stroke/E-stim ANOVA, p > 0.05).

