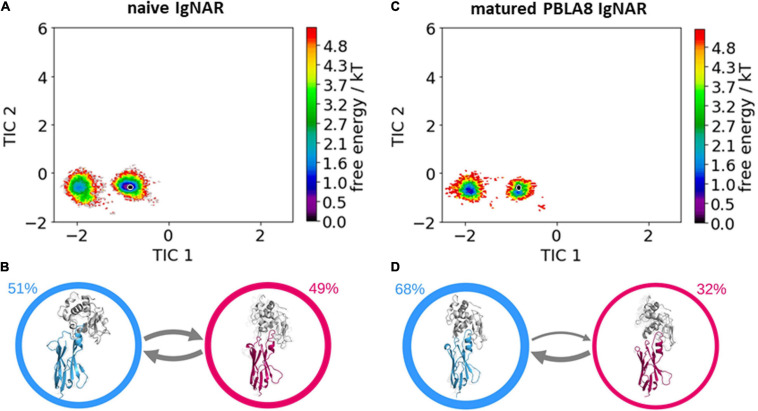
FIGURE 4.
Free energy surfaces and Markov-state models of the complexed naive and matured VNAR CDR3 and CDR1 loops. (A) Free energy surface of the naive VNAR, the starting x-ray structure (PDB accession code: 2I26) is depicted as a black dot. (B) Results of the Markov-state models with the respective macrostate probabilities. The thickness of the arrows denotes the transition timescale and the width of the surrounding circle represents the state population. (C) Free energy surface of the matured VNAR CDR3 and CDR1 loops projected into the same coordinate system as the naive VNAR and the starting crystal structure is also illustrated as a black dot (PDB accession code: 2I25). (D) Agreement with the obtained free energy landscape two macrostates and again the transition timescales and state populations are represented by the thickness of the arrows and the width of the circles, respectively.

