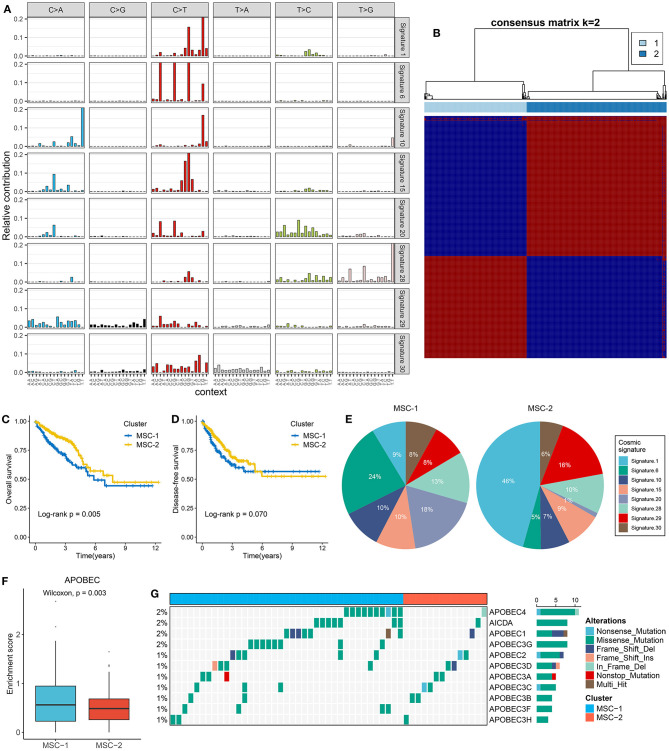
Figure 1.
The extraction of mutation signatures and generation of the mutation signature relevant subtypes in CRC. (A) Eight mutation signatures were deciphered (mutation signature 1, 6, 10, 15, 20, 28, 29, and 30) based on NMF algorithm and COSMIC signatures. (B) The consensus score matrix of all samples when k = 2. A higher consensus score between two samples indicates they are more likely to be grouped into the same cluster in different iterations. The rows and columns of heatmap are both samples, and the cell value of the heatmap is the consensus score between two samples. (C,D) Kaplan–Meier analysis for OS (C) and DFS (D) between MSC-1 and MSC-2. (E) Pie charts show the relative proportion of eight categories of mutation patterns in MSC-1 and MSC-2, respectively. (F) The difference of APOBEC enrichment score between MSC-1 and MSC-2. (G) Mutational oncoplot of 11 APOBEC associated genes in two subtypes.

