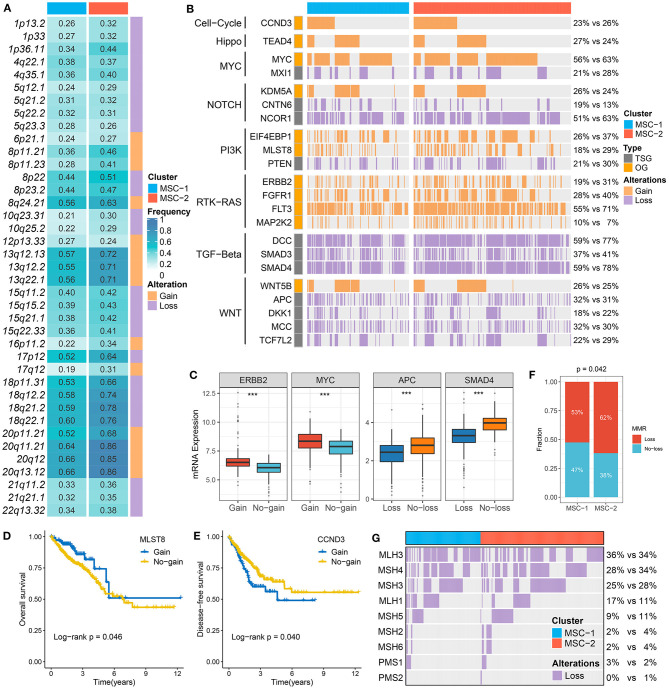
Figure 3.
The driven segments identified from GISTIC algorithm in CRC. (A) The amplification (orange) and deletion (purple) frequency of 39 driven segments in two subtypes. (B) The distribution of CNA relevant oncogenes and tumor suppressive genes in two subtypes. (C) The expression difference of ERRB2 and MYC between the gain and no-gain groups, as well as APC and SMAD4 between the loss and no-loss groups. ***P < 0.001. (D,E) Kaplan–Meier survival analysis of MLST (D) and CCND3 (E) gain. (F) The relative proportion of patients with the MMR genes deletions in two subtypes. (G) Oncoplot for the deletion of nine MMR-related genes in two subtypes.

