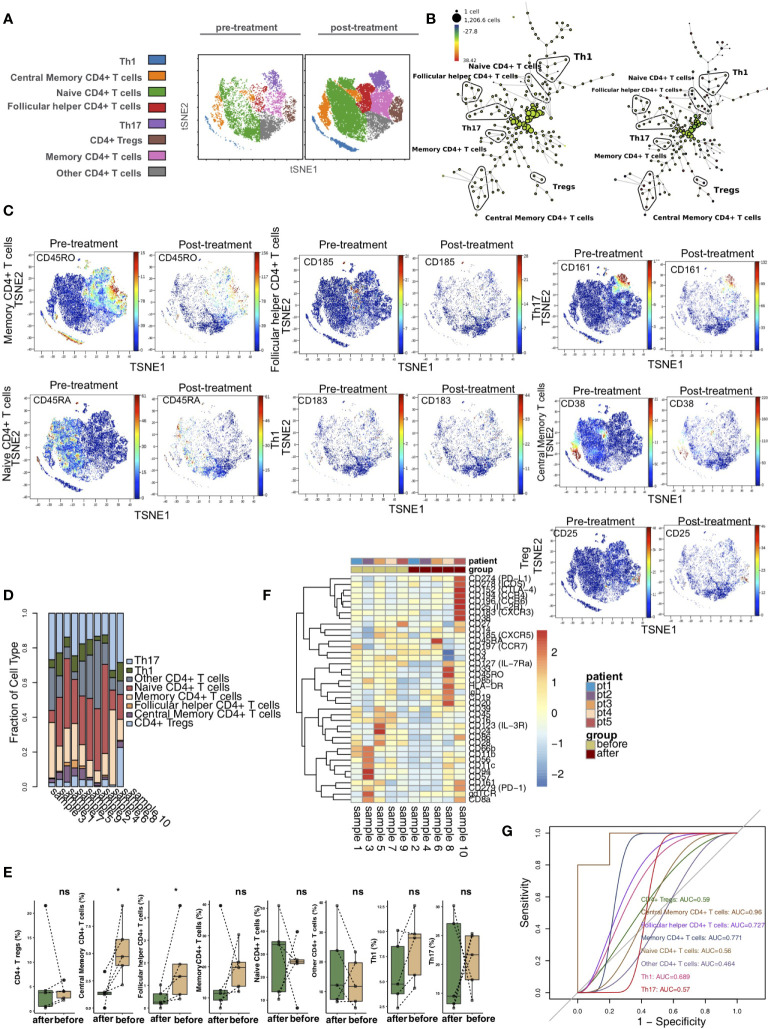
Figure 2.
CD4+ T cell subclusters in the kidney. (A) t-SNE plots of central memory CD4+ T cells, follicular helper CD4+ T cells, naive CD4+ Tregs, Th1 cells and Th17 cells. (B) In SPADE trees, node color is scaled to the fold change in CD38 content, and node size is scaled to the number of cells. (C) t-SNE plots of CD38, CD185, CD45RA, CD25, CD183 and CD161 expression in the pre- and posttreatment groups. (D) The proportions of CD4+ T cell subclusters in all samples. (E) Comparison of the proportions of CD4+ T cell subclusters between the pre- and posttreatment groups. (F) Heatmap of the marker expression of CD4+ T cells for all samples. (G) ROC curve of CD4+ T cell subclusters predicting the pre- and posttreatment groups. *P < 0.05; ns, not significant.

