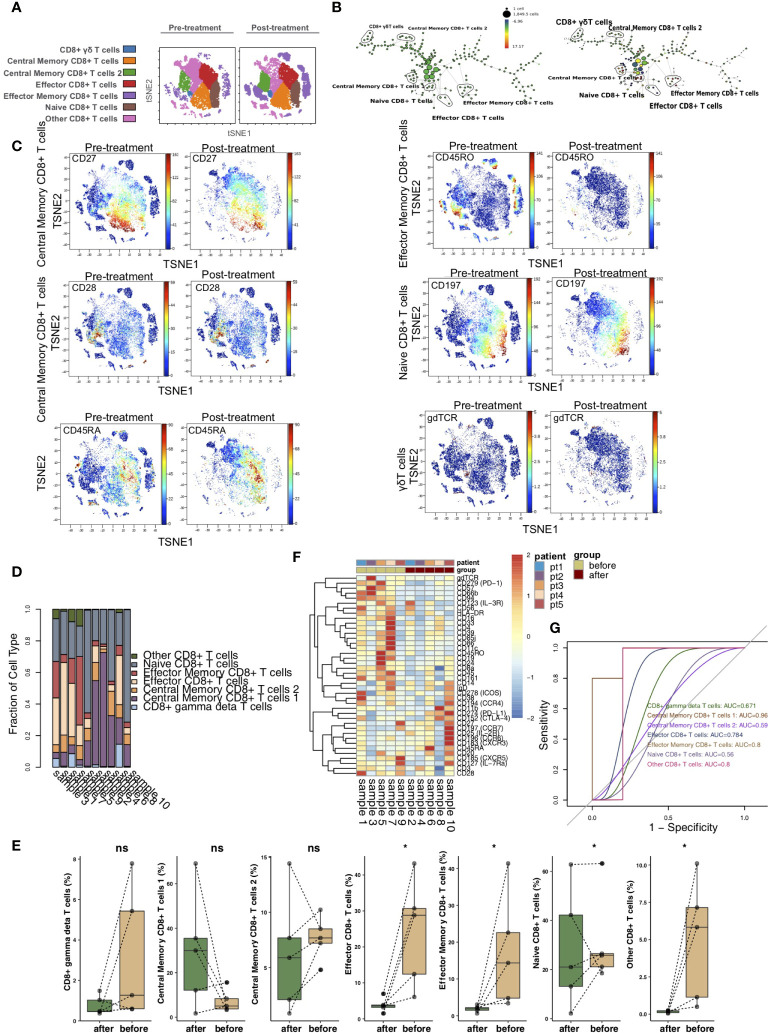
Figure 3.
CD8+ T cell subclusters in the kidney. (A) t-SNE plots of CD8+ γδ T cells, central memory CD8+ T cells 1, central memory CD8+ T cells 2, naive CD8+ T cells, effector CD8+ T cells, effector memory CD8+ T cells and other CD8+ T cells. (B) In SPADE trees, node color is scaled to the fold change in CD197 (CCR7) content, and node size is scaled to the number of cells. (C) t-SNE plots of gdTCR, CD27, CCR7, CD28, CD45RA and CD45RO expression in the pre- and posttreatment groups. (D) The proportions of CD8+ T cell subclusters in all samples. (E) Comparison of the proportions of CD8+ T cell subclusters between the pre- and posttreatment groups. (F) Heatmap of the marker expression of CD8+ T cells for all samples. (G) ROC curve of CD8+ T cell subclusters predicting the pre- and posttreatment groups. *P < 0.05; ns, not significant.

