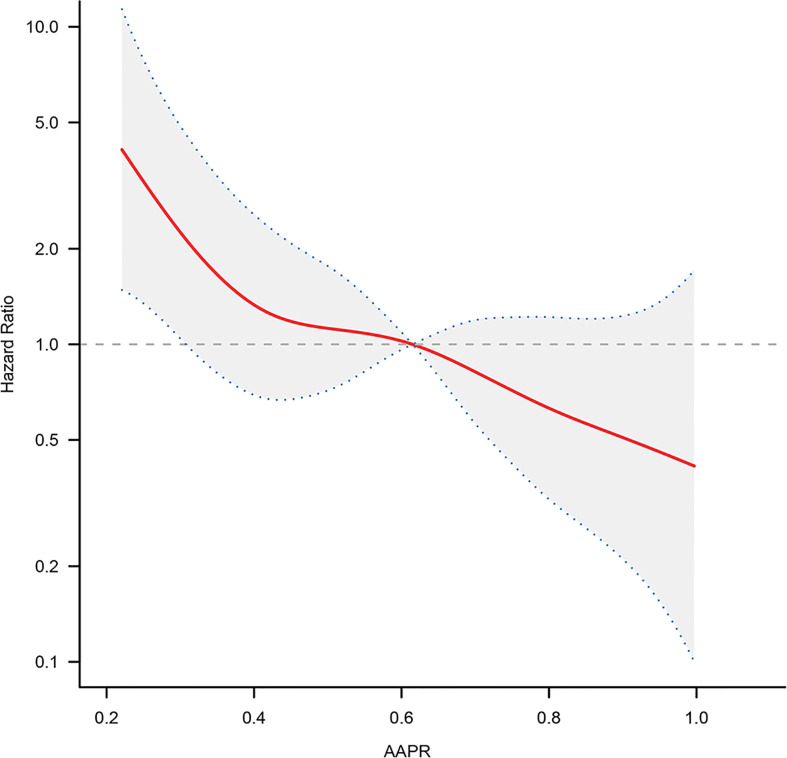
Figure 3.
The adjusted smooth fitting curve between pretreatment AAPR and OS of BC patients based on two-piece-wise regression model. A linear relationship between AAPR and OS was observed. The red solid line and blue dashed line represent the estimated values and their corresponding 95% confidence intervals. OS, overall survival; AAPR, albumin-to-alkaline phosphatase ratio; BC, bladder cancer.

