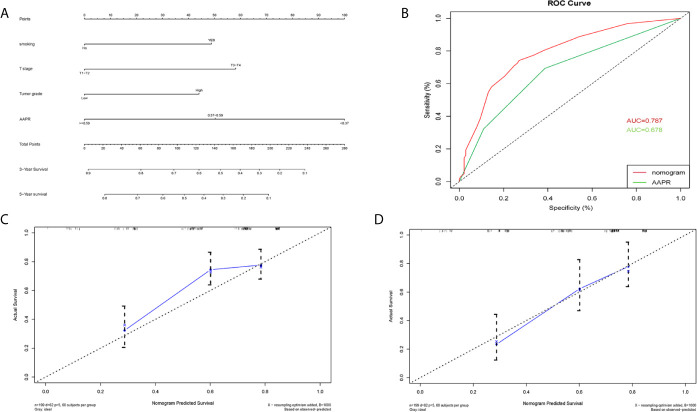
Figure 6.
Nomogram model constructed by independent prognostic factors predicting 3- and 5-year OS for BC patients treated with RC (A); the ROC curve of AAPR and AAPR-based nomogram for predicting OS in the primary cohort (B); corresponding calibration curves of nomogram model for 3- and 5- year OS (C, D). OS, overall survival; AAPR, albumin-to-alkaline phosphatase ratio; BC, bladder cancer; ROC, receiver operating characteristic; AUC, area under curve; CI, confidence interval.

