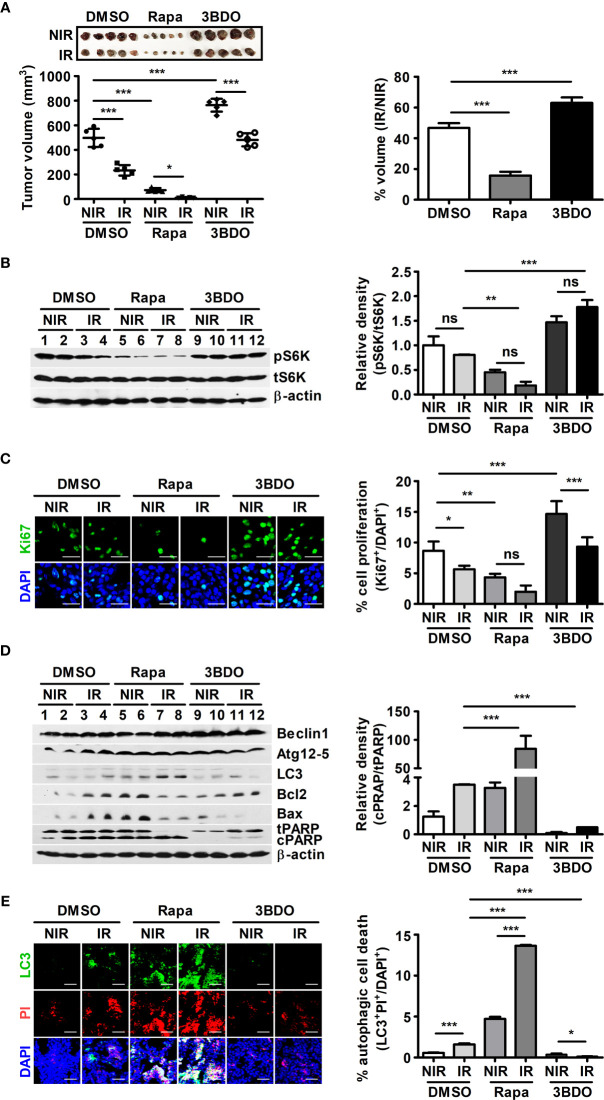
Figure 1.
Pharmaceutical regulation of mTOR activation affects B16F10-tumor development. (A) After tumor resection, all tumors were measured with calipers to calculate tumor volumes (left). To evaluate tumor radiosensitivity, percentages were calculated by dividing the volume of irradiated tumors (IR) by the volume of nonirradiated tumors (NIR) in each group (right). (B) The protein levels of p70 S6K, phospho-p70 S6K, and β-actin in homogenized tumor tissue samples were evaluated by western blotting. The relative density of phosphorylated forms was measured using ImageJ. (C) Intratumoral levels of Ki67 were analyzed by confocal microscopy. Nuclei (blue) and proliferating cells (green) were stained with DAPI and an anti-Ki67 antibody, respectively. Scale bars, 30 μm. (D) The protein levels of Beclin1, Atg12-5, LC3, Bcl2, Bax, PARP, and β-actin in homogenized tumor tissue samples were evaluated by western blotting. (E) Intratumoral levels of LC3 (green) were assessed by confocal microscopy. Nuclei (blue) and damaged cells (red) were stained with DAPI and propidium iodide, respectively. Scale bars, 100 μm. The bars and error bars represent the mean ± SD; *P < 0.05; **P < 0.01; ***P < 0.001; ns, not significant.

