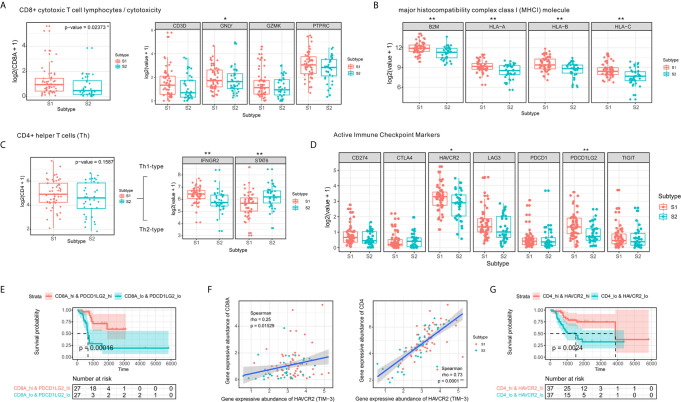
Figure 3.
CD4⁺ Th1 and CD8⁺ cytotoxic T-cell infiltration and increased expression of immune checkpoint molecules. (A) Comparison of expression levels of CD8⁺ T-cell markers. (B) Comparison of expression levels of MHC class I molecules. (C) Boxplot of the expression of CD4⁺ T-cell markers in two the OSA TME subtypes S1 and S2. (D) Comparison of levels of immune checkpoints in the different subtypes (E) Prognostic value of CD8A+PDCD1LG2 co-expression groups based on Kaplan-Meier survival analysis. (F) Spearman correlation between HAVCR2 and CD4/CD8A expression. (G) Prognostic value of CD4+HAVCR2 co-expression groups based on Kaplan-Meier survival analysis. The significance levels of the p-values are presented as *p < 0.05 or **p < 0.01.

