Figure 7.
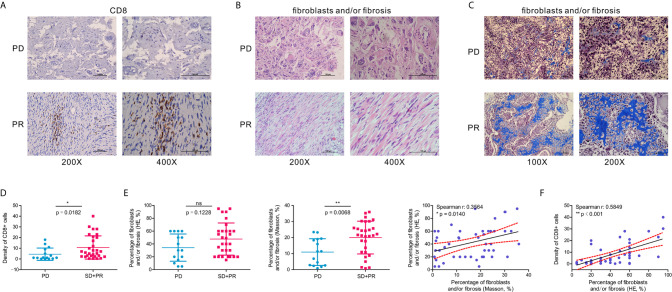
A higher percentage of fibroblasts and/or fibrosis correlates with the abundance of CD8+ cells in OSA tumors. (A) Immunohistochemistry for CD8 expression in OSA tumor tissues. (B, C) H&E staining and Masson’s Trichrome staining of fibroblasts and/or fibrosis in OSA tumors. (D, E) Comparison of the density per high-power field of CD8+ cells, and H&E/Masson’s Trichrome staining score of fibroblasts and/or fibrosis in non-responders (PD) and responders (PR and SD). (F) Correlation analyses of the abundance of CD8+ cells and fibroblasts and/or fibrosis. PD, progressive disease; PR, partial response; SD, stable disease. The significance levels of the p-values are presented as *p < 0.05, **p < 0.01 or ns, not significant p ≥ 0.05.

