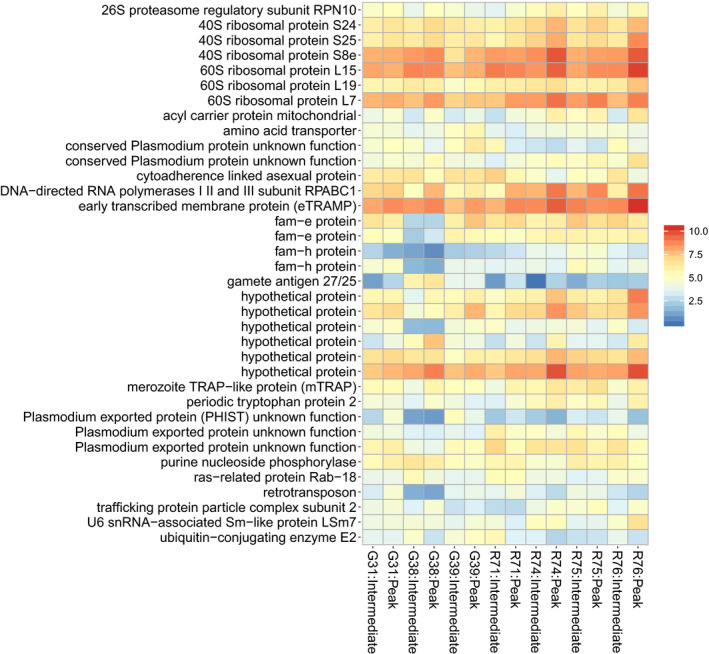
FIGURE 5.

Expression levels of 36 Plasmodium relictum transcripts that were significantly differentially expressed in one or several host individuals (likelihood ratio test, controlled for time and parasitemia). The y‐axis shows the transcripts' protein products and the x‐axis depicts host individual:infection stage. Warmer colors indicate higher expression levels (rlog‐transformed transcript expression values). Transcript IDs can be found in Table S4
