
FIGURE 3.
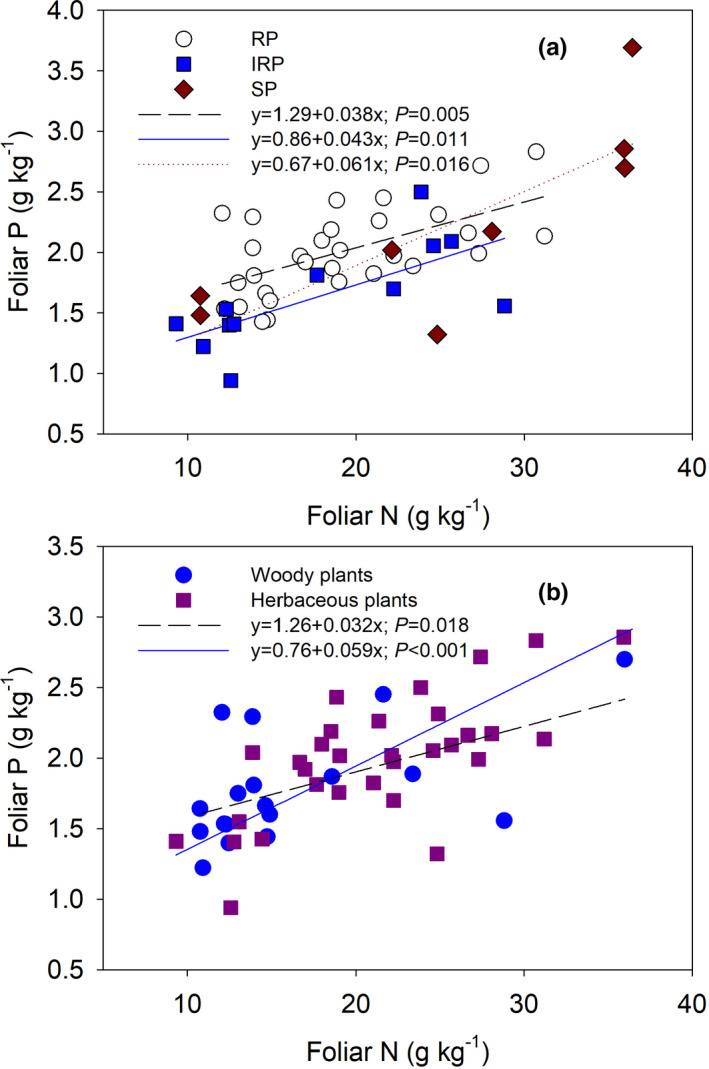
Relationships between foliar N and P concentrations of understory plants with different resistant types (a) and functional groups (b) after long‐term N addition. In the upper (a), open circles with long dash line mean resistant species, solid squares with solid line mean intermediate resistant species, and solid diamonds with short dash line mean sensitive species. In the lower (b), solid circles with solid line mean woody plants and solid squares with long dash line mean herbaceous plants