
FIGURE 8.
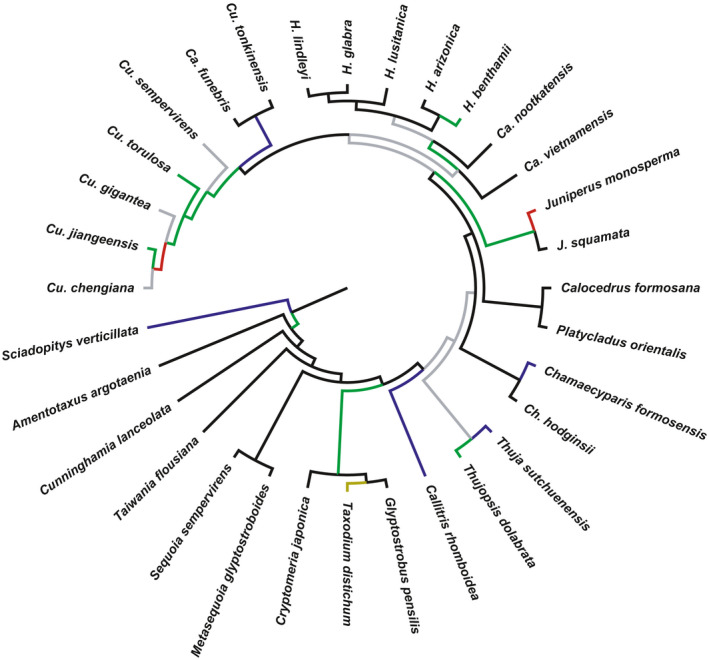
Phylogenetic relationship of Cupressales. Its also a tree file in the PAML analysis. Branches with different colors represent branches with ω > 1 in the three genes in the Branch model that accept the F model. Blue: rps2, Red: atpB, Green: rpoA. Gray: rpoA and rps2 shared. Yellow: three genes shared. The positive selective branches appear mostly in the middle and late stages of the evolution of Cupressaceae