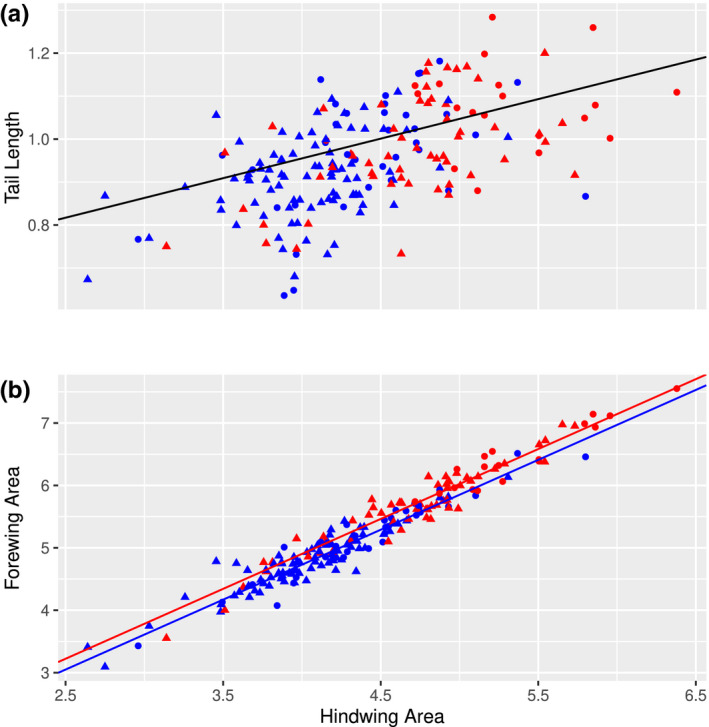
FIGURE 2.

Scatter plots showing (a) tail length (cm) and (b) forewing area (cm2) plotted against hindwing area (cm2) for both sexes (females = red and males = blue) and subspecies (European = circles and British = triangles). No differences in tail length were detected between either sex or subspecies. The line of best fit showing the relationship between tail length and hindwing area is y = 0.486 + 0.107 ± 0.011 x. For a given hindwing area the forewing area of the females was greater than that of the males. The lines of best fit are described by y = 0.392 + 1.122 ± 0.025 x and y = 0.257 + 1.122 ± 0.025 x for the females (red line) and males (blue line) respectively
