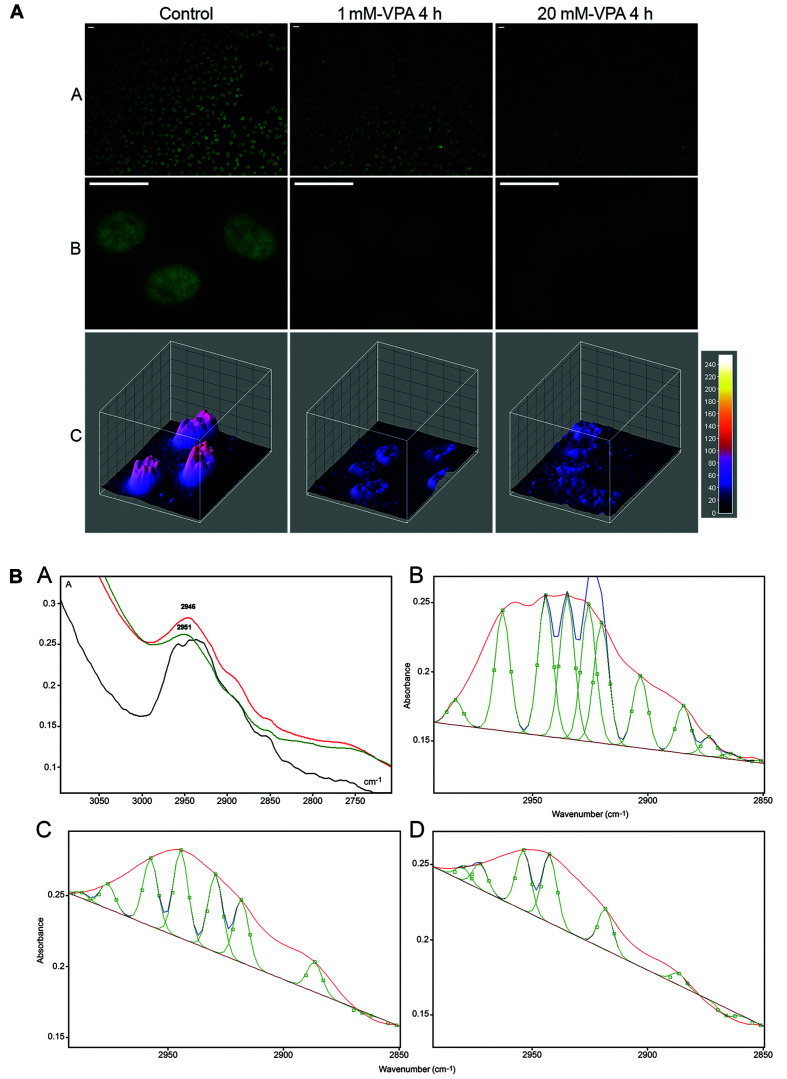
FIGURE 2.
Immunofluorescence signals (A) and FTIR spectral window in the 2,990–2,850 cm–1 wavenumber range (B) for DNA 5mC of HeLa cells cultivated in the presence of VPA. In panel (A), reduction in the DNA 5mC fluorescence signals is shown as assessed visually (A,B) and from images obtained with the ImageJ 3D plugin software (C). In panel (B), the area under the band contributed by -CH3 signals, which decreases with increasing VPA concentration, is evident in the original normalized spectra (A) and after the peak fitting process provided by the Grams/AI 8.0 software [(C) (1 mM VPA) and (D) (20 mM VPA)] compared to the untreated control (B). In the original spectra shown in panel (A), the curve for the untreated control is represented by the black line, whereas the curves for 1 and 20 mM VPA-treated cells are represented by the red and green lines, respectively [reprinted from Veronezi et al. (2017). PLoS ONE 12(1): e0170740].

