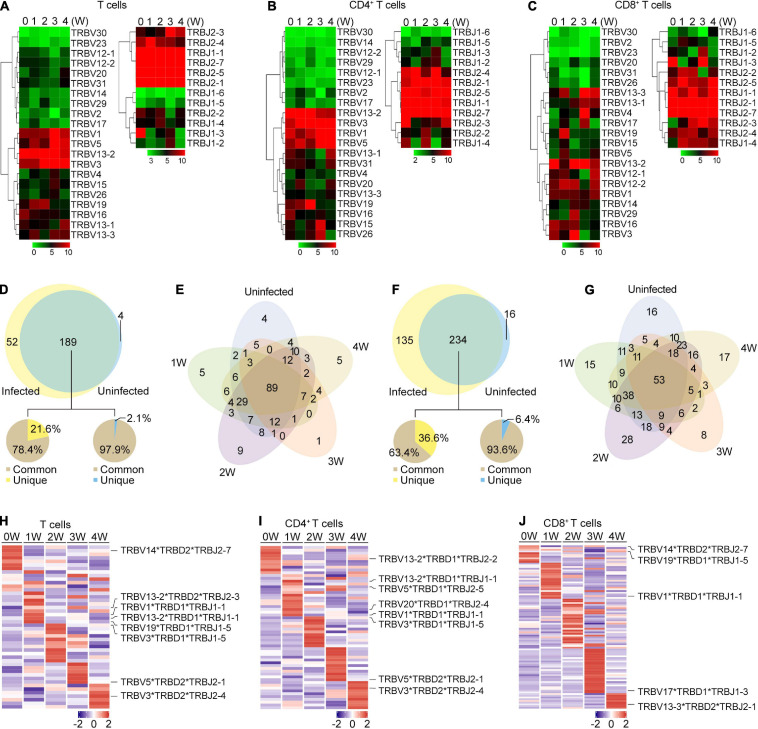
FIGURE 4.
TRB gene usage in Pneumocystis infected and uninfected mice. (A–C) Heat maps of V and J gene usage for TRB in T cells (A), CD4+ T cells (B), and CD8+ T cell (C) at different timepoints. (D) Venn diagram showing the common and unique V-J gene pairs of Pneumocystis-infected mice and uninfected controls. Pie charts showing the proportion of cells that harbored common and unique V-J pairs in Pneumocystis-infected mice (left) and uninfected controls (right). (E) Venn diagram showing the common and unique V-J gene pairs of mice infected with Pneumocystis from 0 to 4 weeks. (F) Common and unique V-D-J gene pairs of Pneumocystis-infected mice and uninfected controls. Pie charts showing the proportion of cells that harbored common and unique V-D-J pairs in Pneumocystis-infected mice (left) and uninfected controls (right). (G) Venn diagram showing the common and unique V-D-J gene pairs of mice infected with Pneumocystis from 0 to 4 weeks. (H–J) Heat maps showing the top 10 V-D-J gene combinations that were most frequently used in T cells (H), CD4+ T cells (I), and CD8+ T cells (J), of which the most frequently used combinations are shown in labels.

