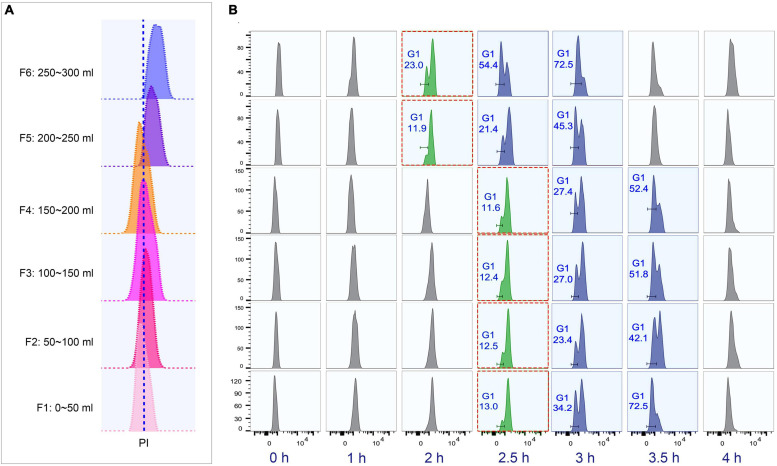
FIGURE 5.
Cell cycle analysis of elutriated Tetrahymena thermophila cells of different collection volume. Nuclei were stained with propidium iodide (PI) and analyzed by flow cytometry. (A) Flow cytometry profiles of six fractions collected at 60 ml/min flow rate (the dotted line demarcates the G1 PI peak). (B) Cell cycle progression of six fractions. The elutriated cells were cultured and sampled at 30 min intervals. The red boxes highlight that different fractions reach a similar state of G1 and G2/Amitosis at different time points. The x-axis represents the logarithm of the DNA content (PI fluorescence intensity) and the y-axis represents the number of events (number of events = 10,000).

