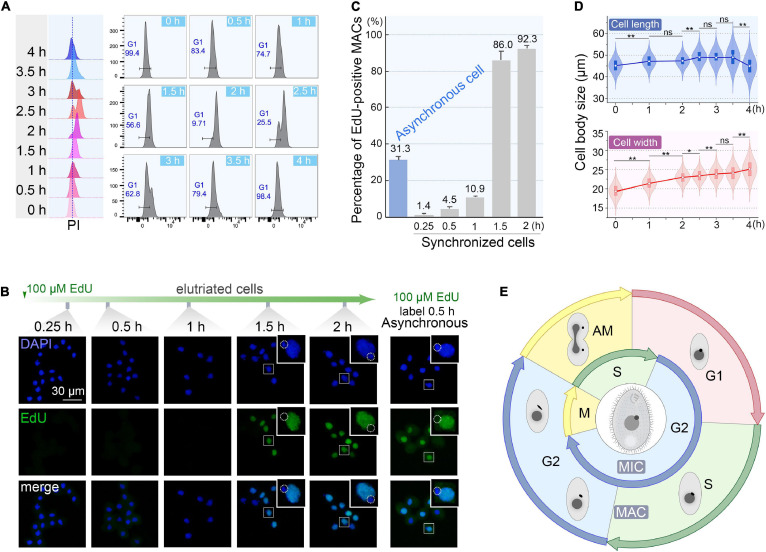
FIGURE 6.
Quality assessment of synchronized cells. (A) Cell cycle progression of synchronized Tetrahymena thermophila. Histograms show the percentage of G1 cells representing the propidium iodide (PI) signal (x-axis) versus cell count (y-axis) (number of events = 10,000). (B) Fluorescent images of synchronous and asynchronous cells labeled by EdU. Synchronized cells were cultured continuously in medium containing 100 μM EdU and sampled at successive time points after elutriation. Asynchronous cells (SB210) were cultured with EdU for 30 min. DAPI staining marks all nuclei (blue signal, exposure time: 0.6 ms). EdU incorporation signal shows macronuclear DNA synthesis (green signal). Note that EdU signals were not detectable in MICs (dotted line circles), which were mostly in the G2 phase. (C) Statistical analysis of EdU labeled MACs from panel B. Data are presented as mean ± standard deviations. (D) The violin/box plots showing length and width distribution in synchronized cells (n > 300) at different culture intervals post-elutriation. Boxes represent the median and central quartiles; statistical significance was established using Student’s t-test. **P < 0.01, *0.01 ≤ P < 0.05, ns P ≥ 0.05. (E) Diagram of the cell cycle of synchronized Tetrahymena. The outer circle represents MAC events; the inner circle depicts MIC events. The germline MIC divides by mitosis, whereas the somatic MAC divides by amitosis.

