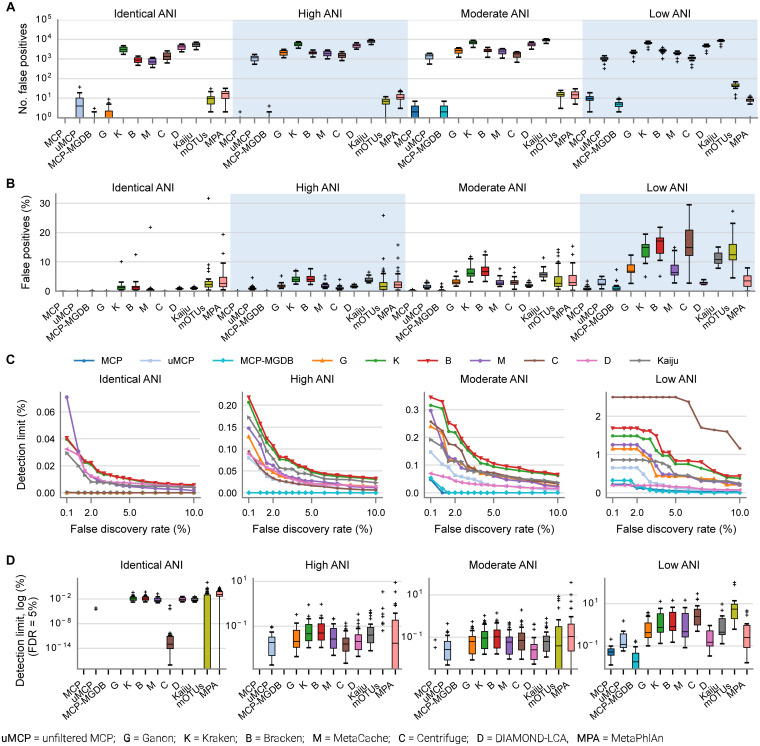
FIGURE 1.
Metagenomic classifiers have different minimum species abundance limits at which species can be reliably detected. (A) Number of false positive species predictions made by each classifier on mock communities with decreasing ANI similarity to reference database genomes. (B) Percentage of predicted community profiles comprised of false positive predictions. The relatively low community percentages indicate that the majority of false positive predictions are low abundance species. With the exception of the MCP, mOTUs, and MetaPhlAn, these results illustrate that low abundance species must be filtered from the profiles predicted by metagenomic classifiers in order to reduce false positive predictions. (C) Median detection limit of each classifier over all mock communities at a given level of ANI similarity to the reference database for varying FDRs. MCP, uMCP, and Ganon report zero false positives for mock communities comprised of genomes in the reference database (identical ANI) and consequently have a median detection limit reported as 0% indicating that all species could be identified without any false positives. Centrifuge and MCP-MGDB only report extremely low abundance false positives for the identical ANI mock communities resulting in median detection limits of 0.00036 and 0%, respectively. Results for mOTUs and MetaPhlAn are not shown as they have substantially higher detection limits than the other classifiers (Supplementary Figure 1 and Table 3). (D) Detection limit of each classifier on each mock community resulting in an FDR of 5%. MCP, MCP-MGDB, and Ganon have detection level at or near 0% across all samples at a number of ANI levels so do not produce visible box-and-whisker plots (see Table 3). The box-and-whisker plots show the lower and upper quartiles as a box, the median value as a line within the box, 1.5X the interquartile range as whiskers, and outliers as crosses.

