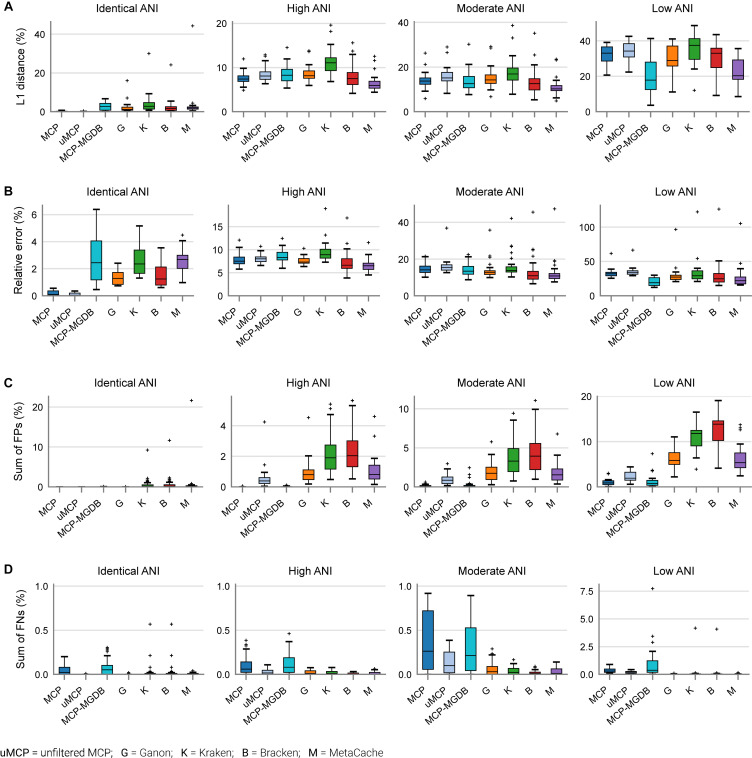
FIGURE 3.
Performance of metagenomic classifiers to predict species abundances. (A) L1 distance (0% = identical to ground truth; 200% = no species in common with ground truth) between the ground truth and predicted species profiles. (B) Mean relative error of species present in both the ground truth and predicted species profiles. (C) Sum of false positive species abundances. (D) Sum of false negative species abundances. Lower values indicate better performance. Results are provided across mock communities of increasing ANI divergence from the reference database. Results for Centrifuge, DIAMOND-LCA, Kaiju, and mOTUs are not shown as they have substantially worse species abundance estimates than the other classifiers (Supplementary Figure 2).

