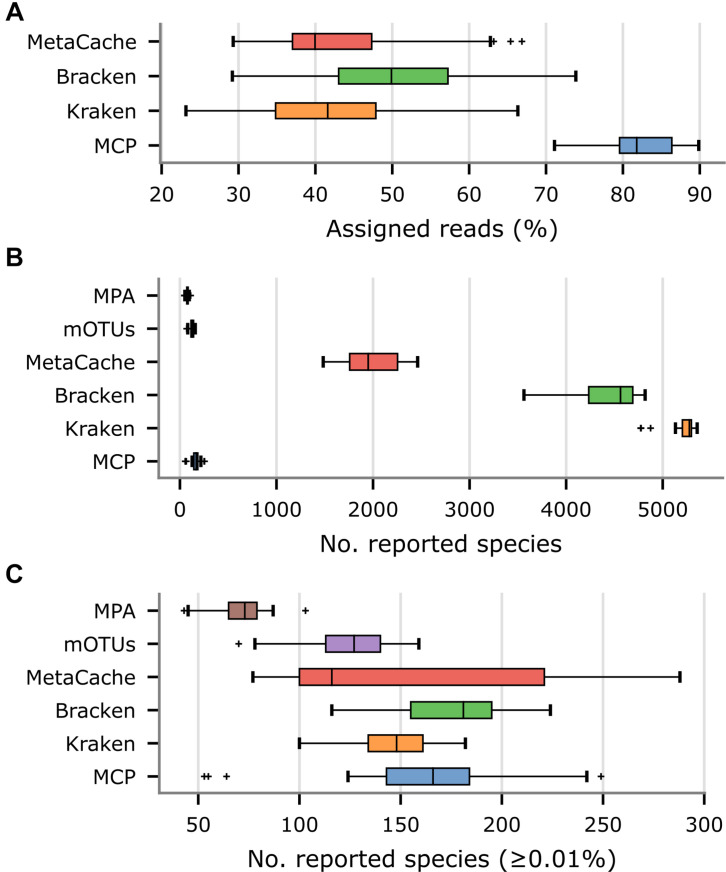
FIGURE 4.
Comparison of metagenomic classifiers on 33 US fecal samples. Community profiles were produced by each classifier using their recommended reference database. (A) Percentage of reads assigned to a species in community profiles. (B) Number of species reported by each classifier. (C) Number of species reported by each classifier with an estimated abundance ≥ 0.01%.

